by planckC
Hot Planet
IPFS
PARAMS
18 April 2023•TEZOS•IPFS
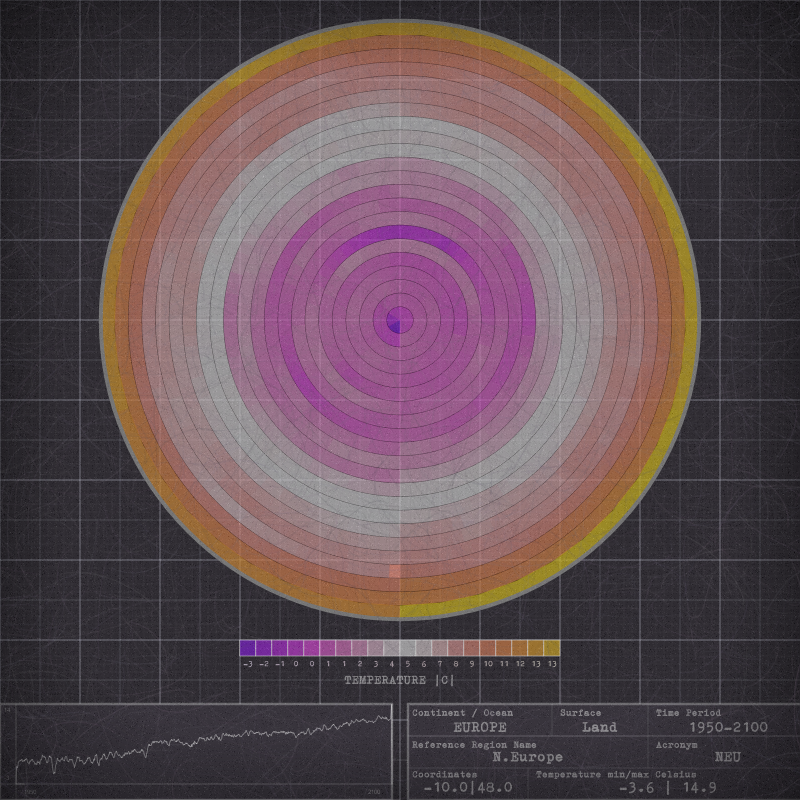
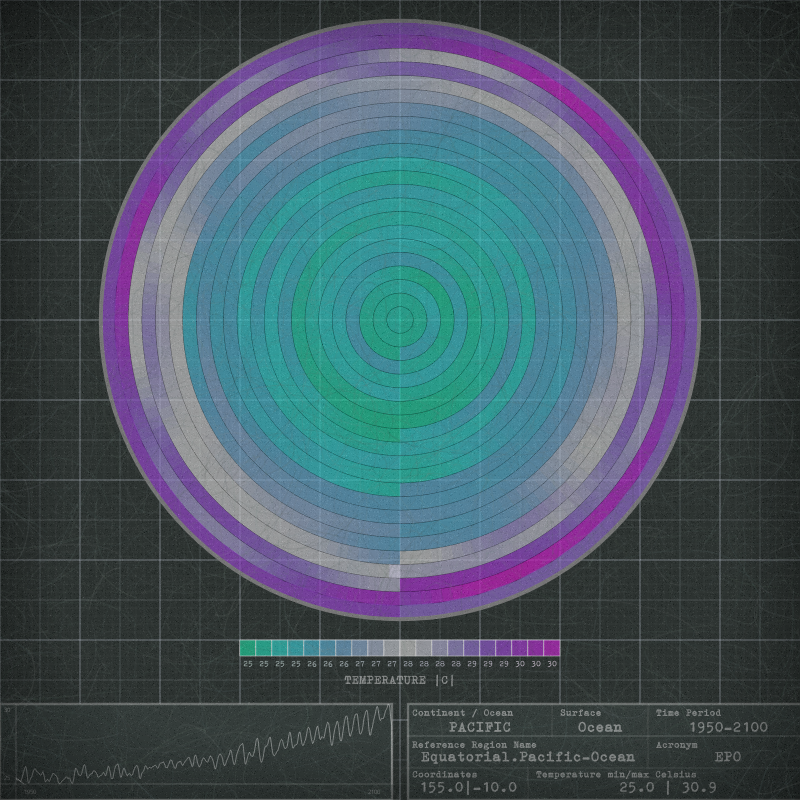
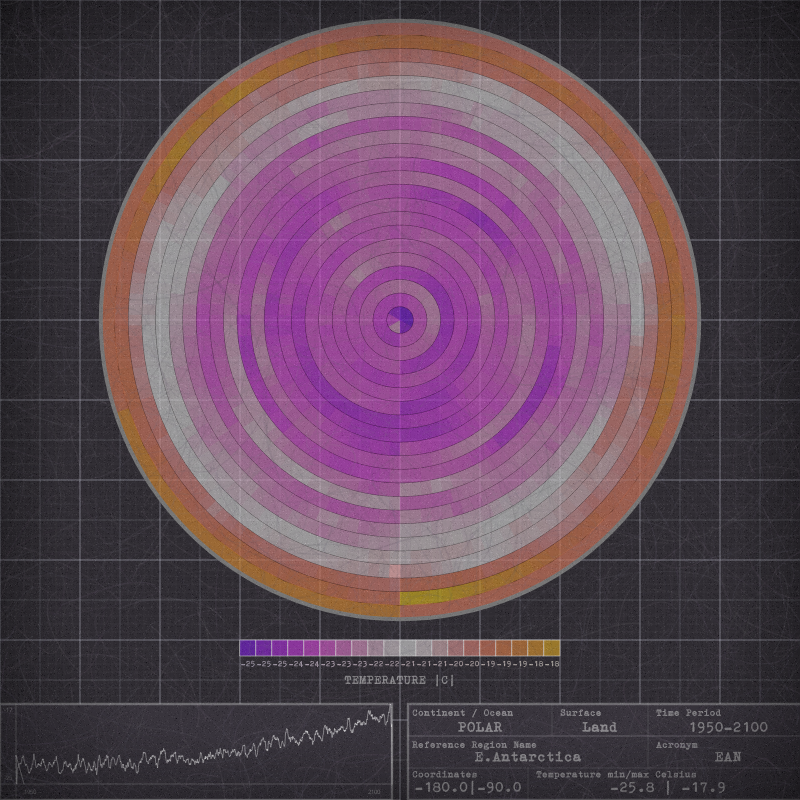
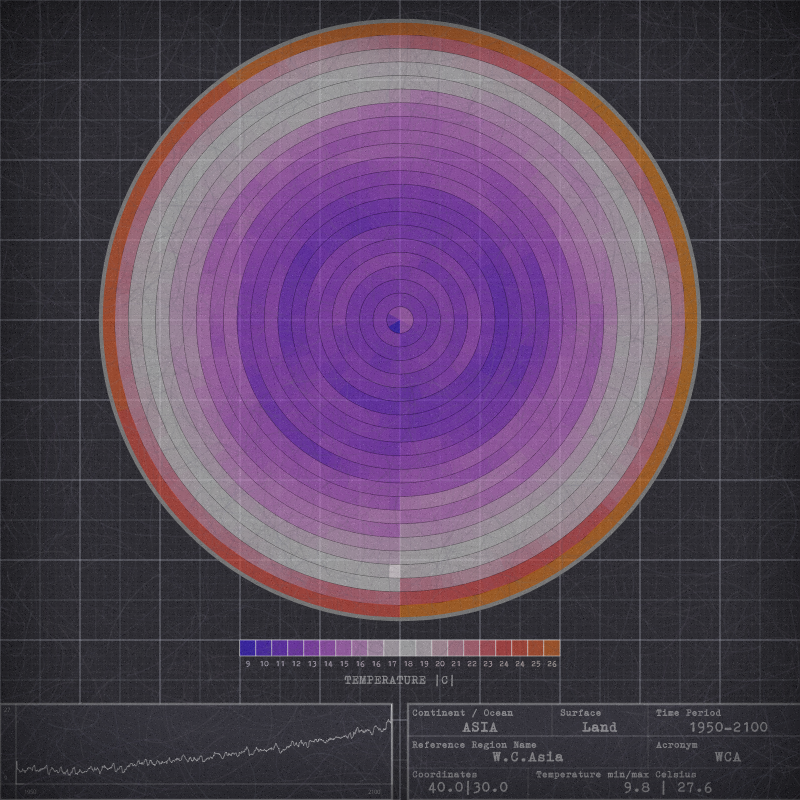
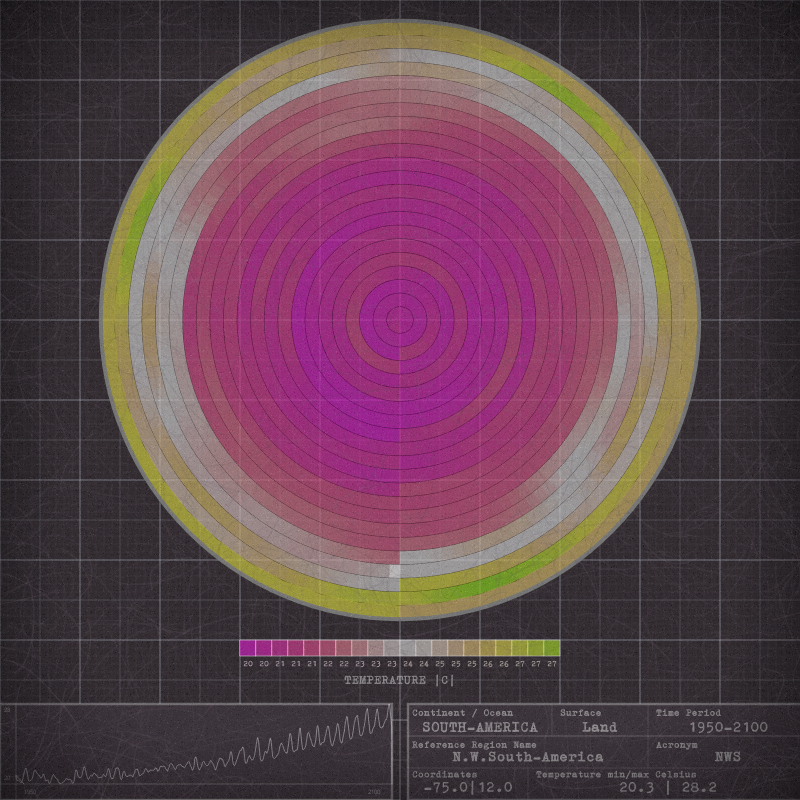
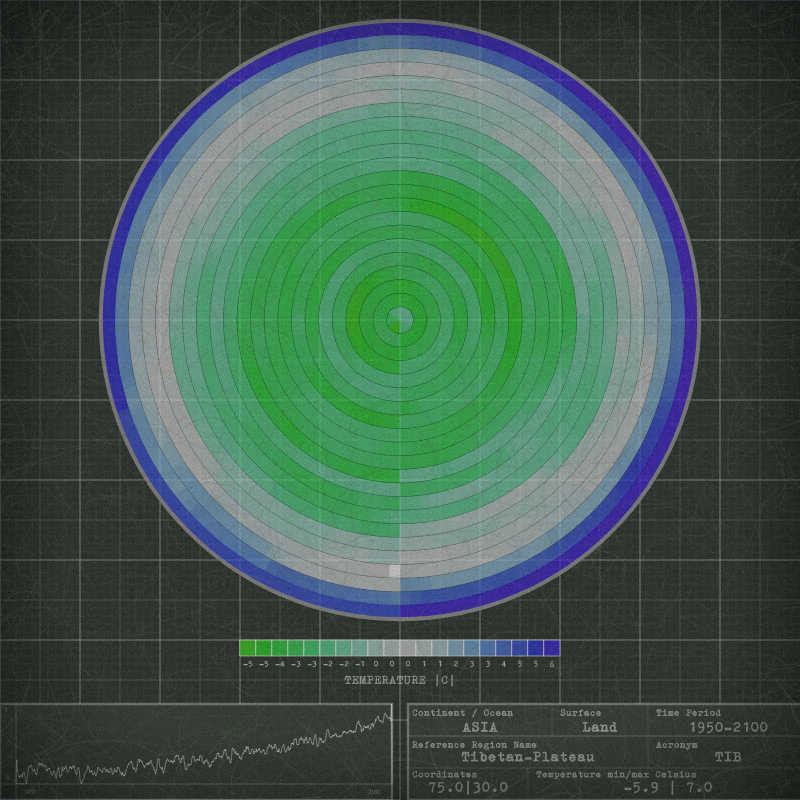
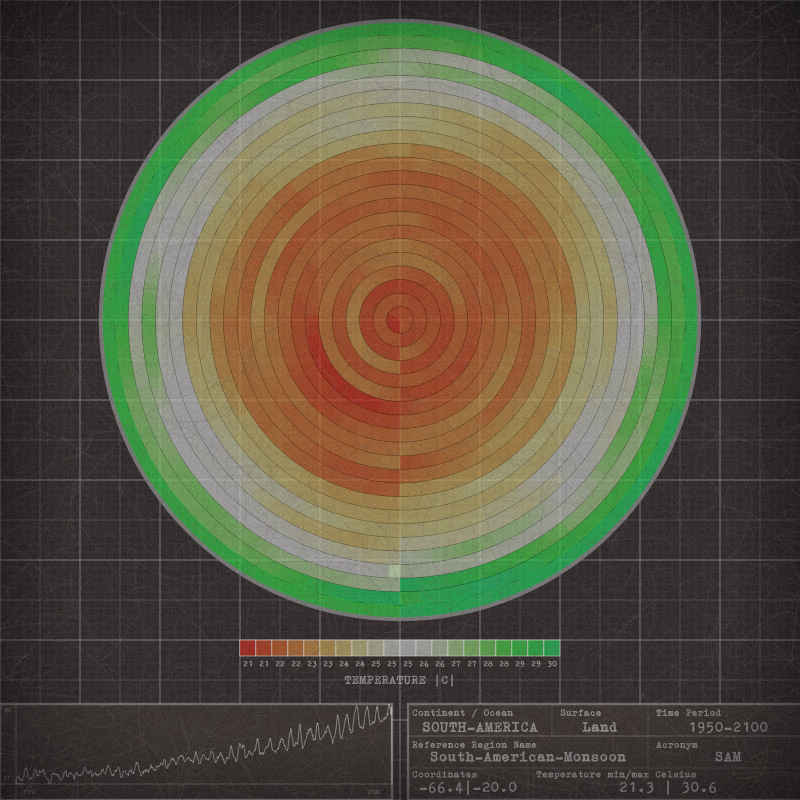
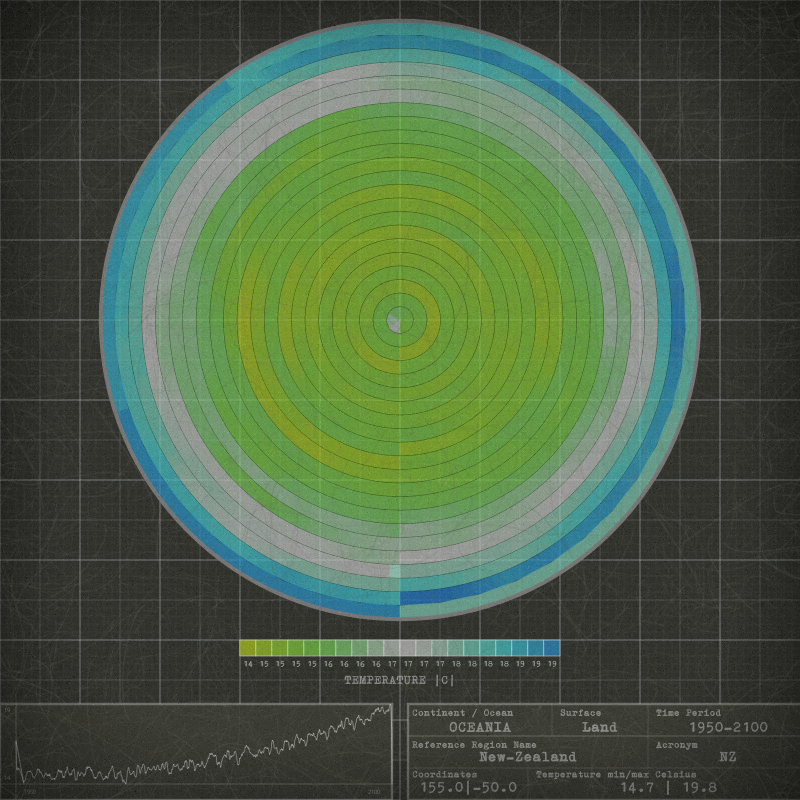
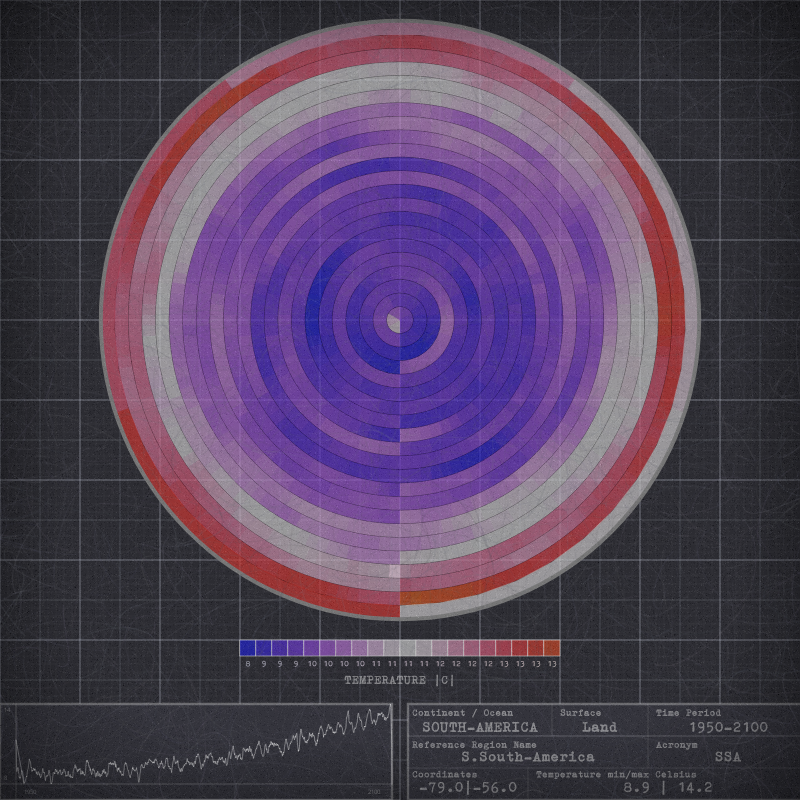
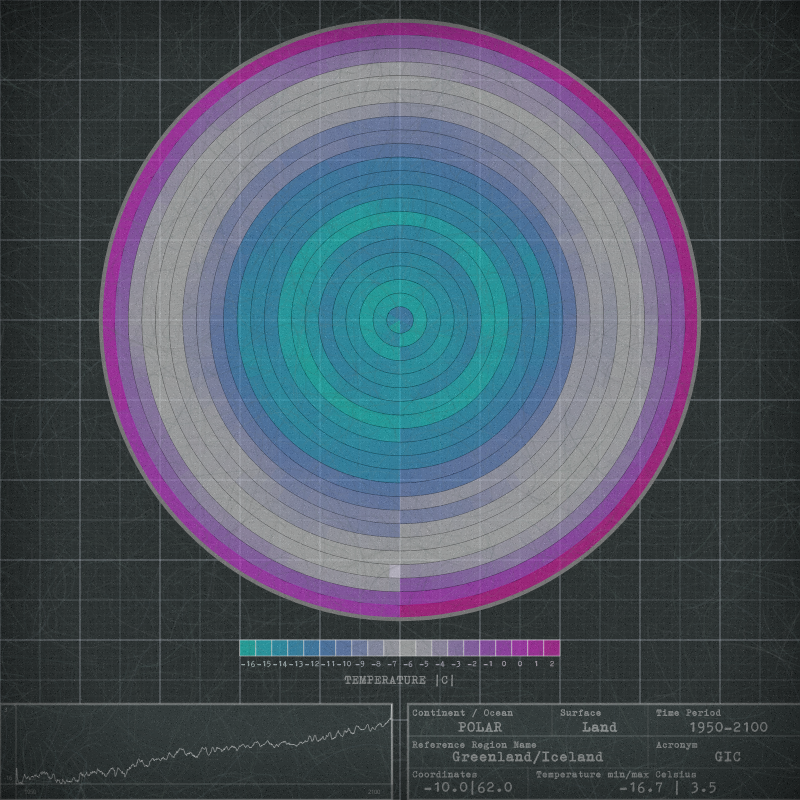
"Hot Planet" is a generative artwork that visualizes the impact of climate crises on global temperature patterns.
"Hot Planet" makes use of historical temperature data from 1950 as well as future projections based on the SSP5-8.5 scenario. Shared Socioeconomic Pathways (SSPs) are scenarios of projected socioeconomic global changes up to 2100. They are used to derive greenhouse gas emissions scenarios with different climate policies. The data was obtained from the IPCC WGI Interactive Atlas.
The temperatures are displayed in a concentric circle pattern. The color palette is spread across the minimum and maximum temperatures of the 1950–2100 period.
At the bottom right there are various information about the location, coordinates, min/max temperature, acronym of the location. A temperature vs. time graph can be found on the bottom left.
Using fxParams you can select the area of the earth that you want to visualize. There are 58 areas (land, ocean, and land-ocean) to select from.
Global warming is a major environmental and social challenge facing the world today. The scientific consensus is that global temperatures are rising at an unprecedented rate, largely as a result of human activities such as burning fossil fuels, deforestation, and industrial processes. The consequences of global warming are wide-ranging and severe, including melting glaciers and sea ice, rising sea levels, ocean acidification, changes in precipitation patterns, and increased frequency and severity of extreme weather events.
"Hot Planet" tries to raise awareness about global warming, its consequences and the urgent need for action.
100% code.
Press [s] to save a 4000x4000 pixels PNG file.
Artist, working on the fusion of art and science
64 EDITIONS
•0 RESERVES
minted
9 / 64
fixed price
12 TEZ
Lorem ipsum project longer longer
0.00001 ETH
Lorem ipsum project longer longer
0.00001 ETH
Lorem ipsum project longer longer
0.00001 ETH
Lorem ipsum project longer longer
0.00001 ETH
Lorem ipsum project longer longer
0.00001 ETH
Lorem ipsum project longer longer
0.00001 ETH
Lorem ipsum project longer longer
0.00001 ETH
Lorem ipsum project longer longer
0.00001 ETH
Lorem ipsum project longer longer
0.00001 ETH
Lorem ipsum project longer longer
0.00001 ETH
Lorem ipsum project longer longer
0.00001 ETH
Lorem ipsum project longer longer
0.00001 ETH
Lorem ipsum project longer longer
0.00001 ETH
Lorem ipsum project longer longer
0.00001 ETH
Lorem ipsum project longer longer
0.00001 ETH
Lorem ipsum project longer longer
0.00001 ETH
Lorem ipsum project longer longer
0.00001 ETH
Lorem ipsum project longer longer
0.00001 ETH
Lorem ipsum project longer longer
0.00001 ETH
Lorem ipsum project longer longer
0.00001 ETH
Lorem ipsum project longer longer
0.00001 ETH
Lorem ipsum project longer longer
0.00001 ETH
Lorem ipsum project longer longer
0.00001 ETH
Lorem ipsum project longer longer
0.00001 ETH
