by Ricky
Generative Charts #02
IPFS
28 November 2021•TEZOS•IPFS
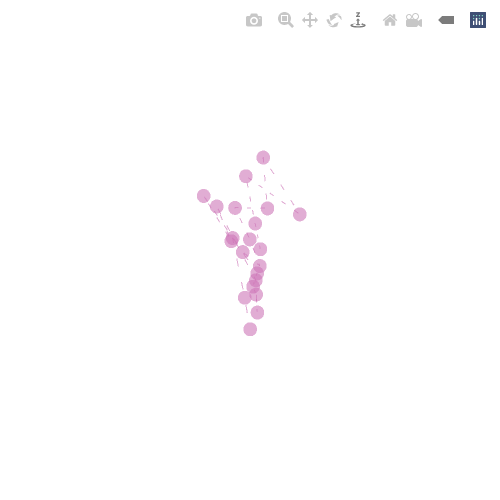
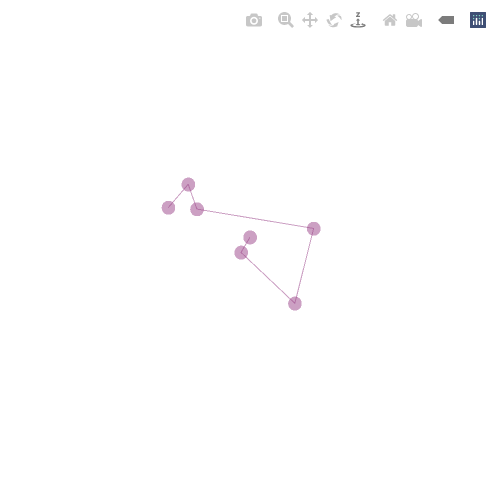
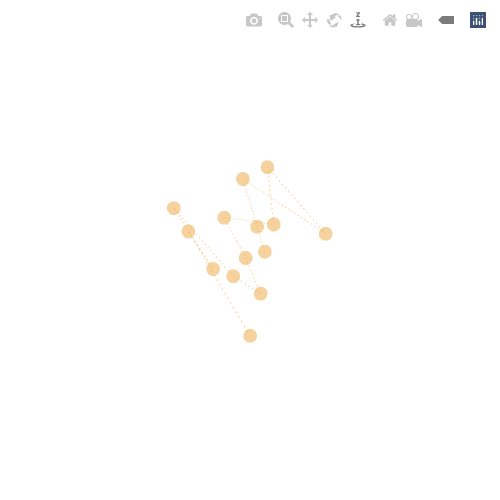
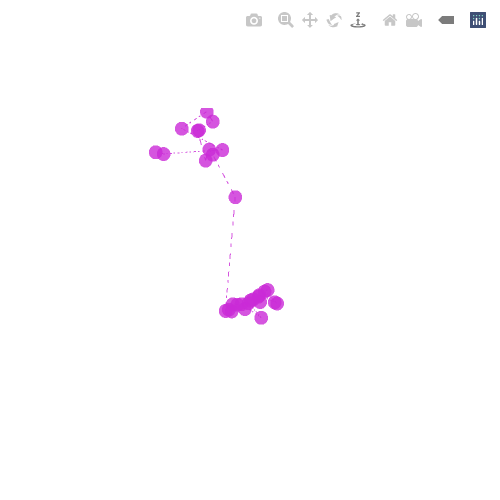
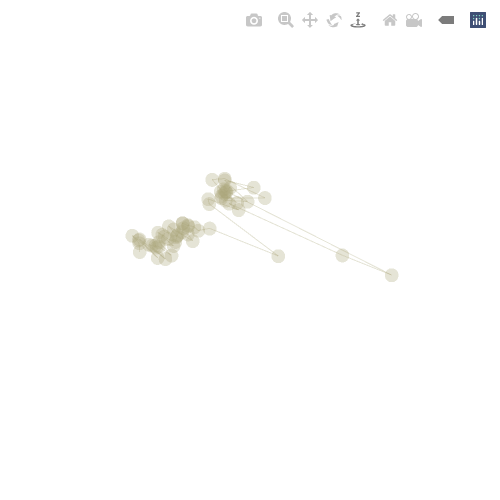
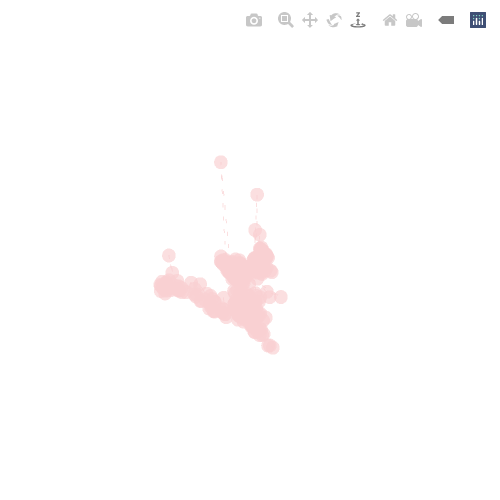
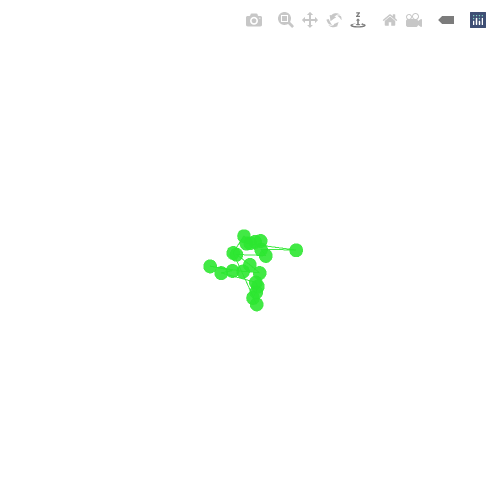
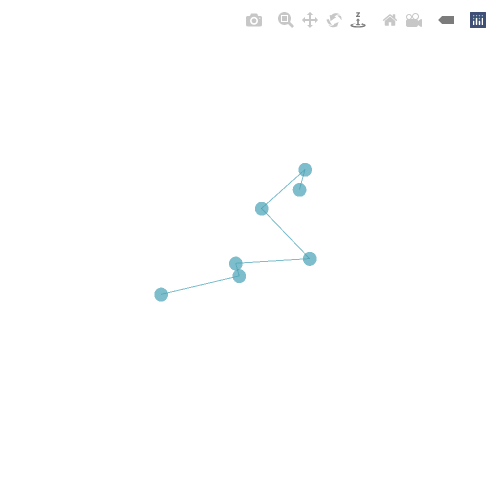
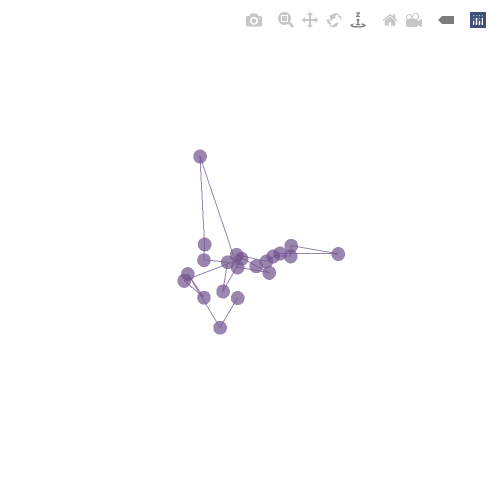
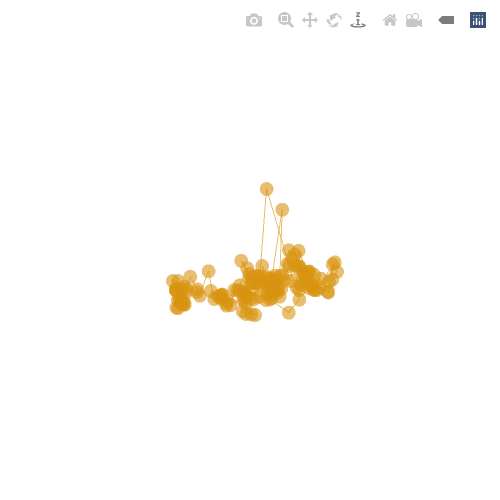
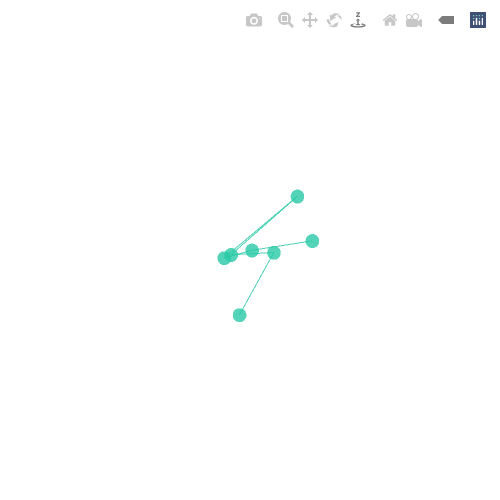
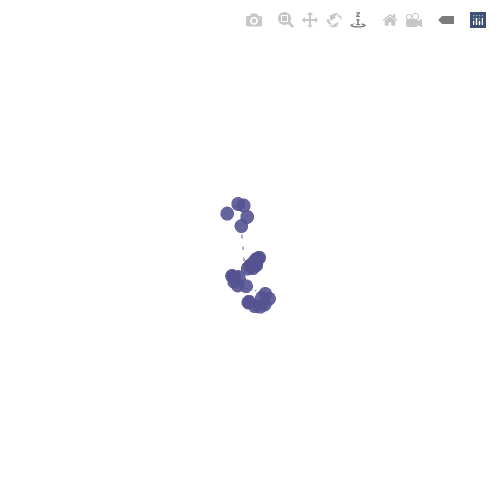
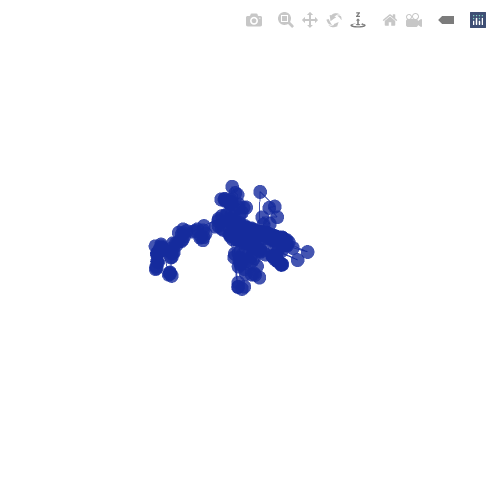
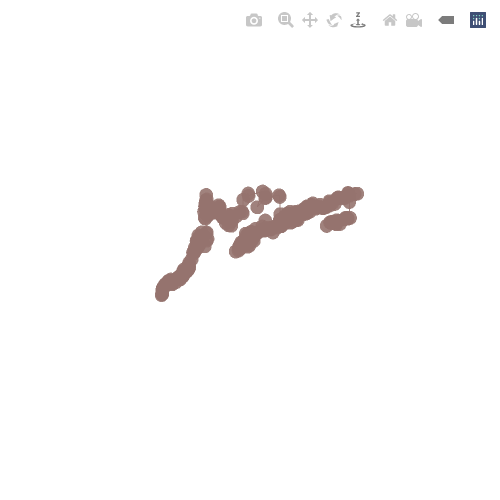
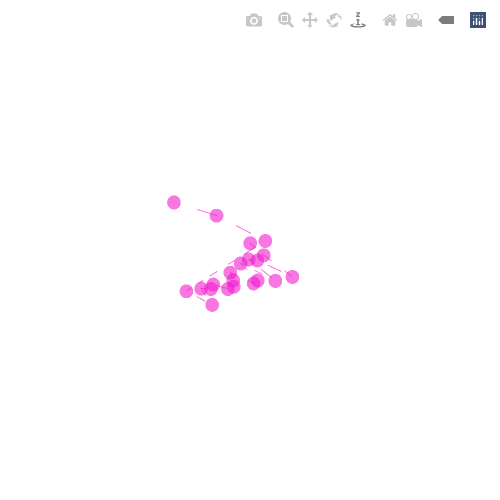
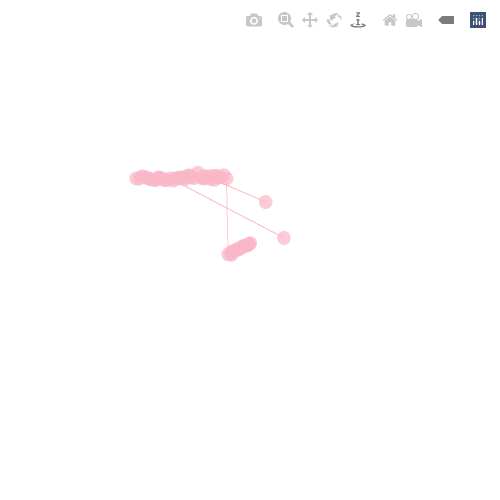
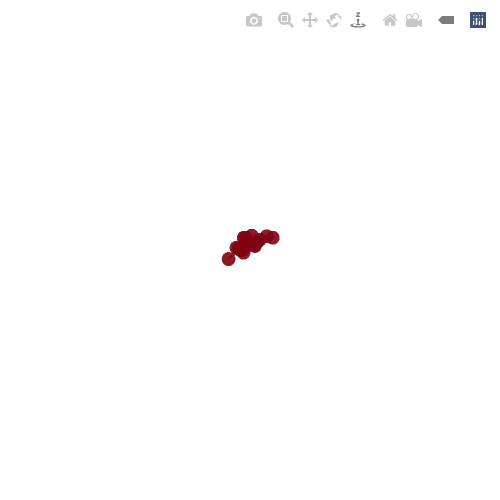
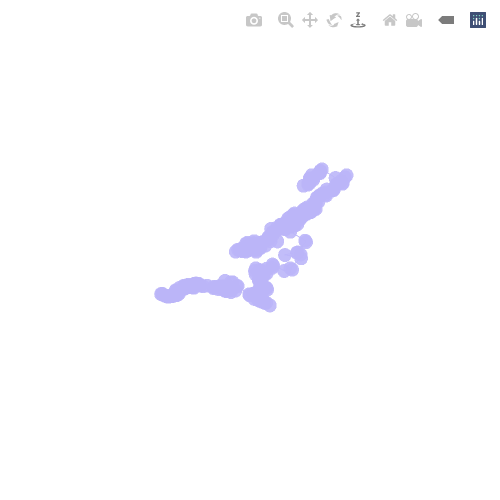
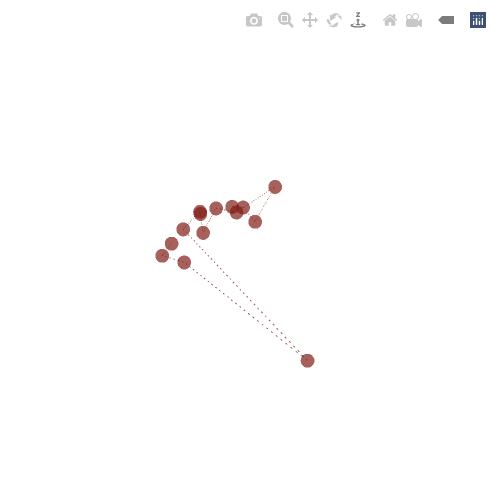
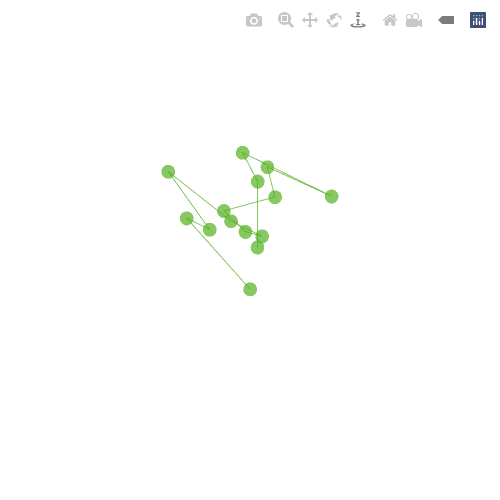
Click and drag to adjust camera. Hover on points to view data.
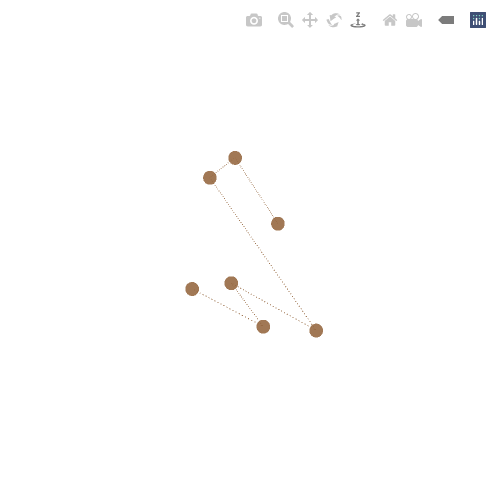
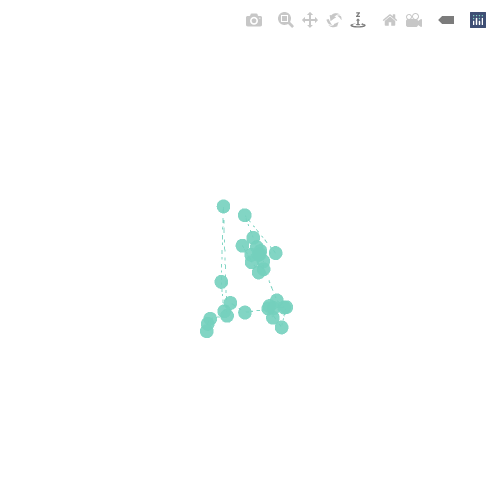
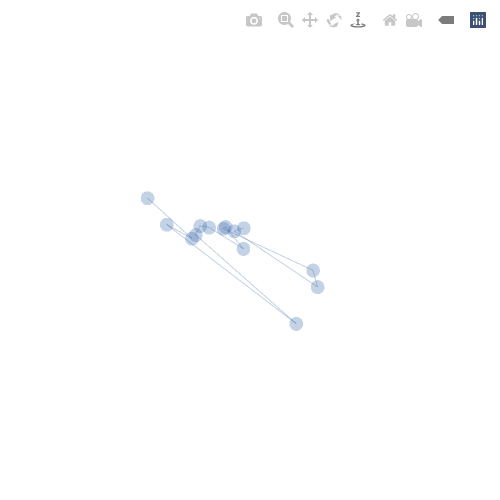
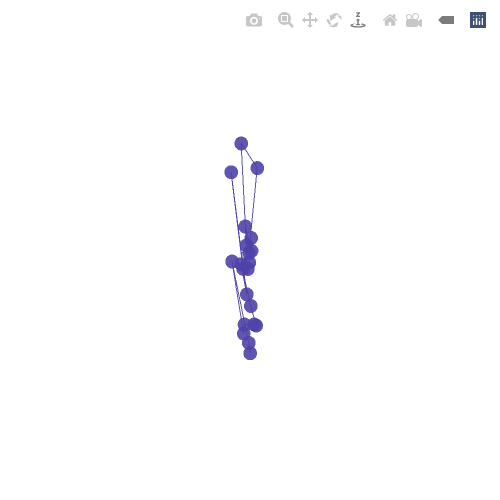
Each 3d chart has a set of unique features:
- 14 cryptocurrency tokens
- 7 date ranges
- 6 variables visualized (variable 1)
- 6 variables visualized (variable 2)
- 5 line types
- 7 opacity settings
- many colors
Once a unique chart is created it will keep evolving with the latest data every time it is viewed. One point per day. Uses The Graph Sushiswap data (https://thegraph.com/explorer/subgraph?id=0x4bb4c1b0745ef7b4642feeccd0740dec417ca0a0-0).
Real live data is visualized, hover on points for info.
⚠️ highly experimental ⚠️
555 EDITIONS
•0 RESERVES
minted
555 / 555
fixed price
0 TEZ
Lorem ipsum project longer longer
0.00001 ETH
Lorem ipsum project longer longer
0.00001 ETH
Lorem ipsum project longer longer
0.00001 ETH
Lorem ipsum project longer longer
0.00001 ETH
Lorem ipsum project longer longer
0.00001 ETH
Lorem ipsum project longer longer
0.00001 ETH
Lorem ipsum project longer longer
0.00001 ETH
Lorem ipsum project longer longer
0.00001 ETH
Lorem ipsum project longer longer
0.00001 ETH
Lorem ipsum project longer longer
0.00001 ETH
Lorem ipsum project longer longer
0.00001 ETH
Lorem ipsum project longer longer
0.00001 ETH
Lorem ipsum project longer longer
0.00001 ETH
Lorem ipsum project longer longer
0.00001 ETH
Lorem ipsum project longer longer
0.00001 ETH
Lorem ipsum project longer longer
0.00001 ETH
Lorem ipsum project longer longer
0.00001 ETH
Lorem ipsum project longer longer
0.00001 ETH
Lorem ipsum project longer longer
0.00001 ETH
Lorem ipsum project longer longer
0.00001 ETH
Lorem ipsum project longer longer
0.00001 ETH
Lorem ipsum project longer longer
0.00001 ETH
Lorem ipsum project longer longer
0.00001 ETH
Lorem ipsum project longer longer
0.00001 ETH
