B.R. & Hendrik - Mysterious Zeta Function
IPFS
14 March 2023•TEZOS•IPFS
Keyboard controls:
[D] - Download/save the graph-picture.
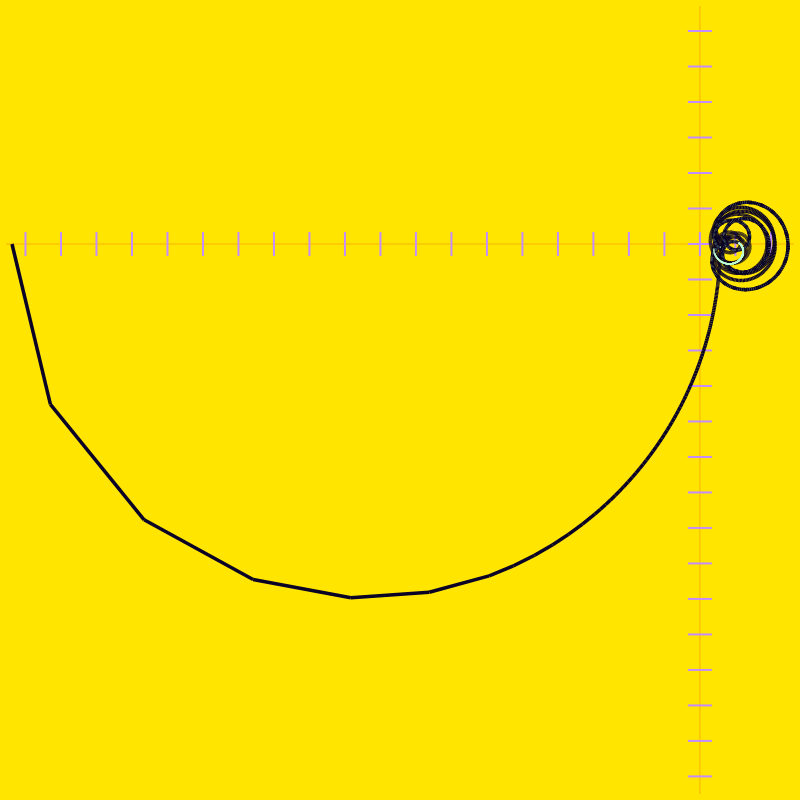
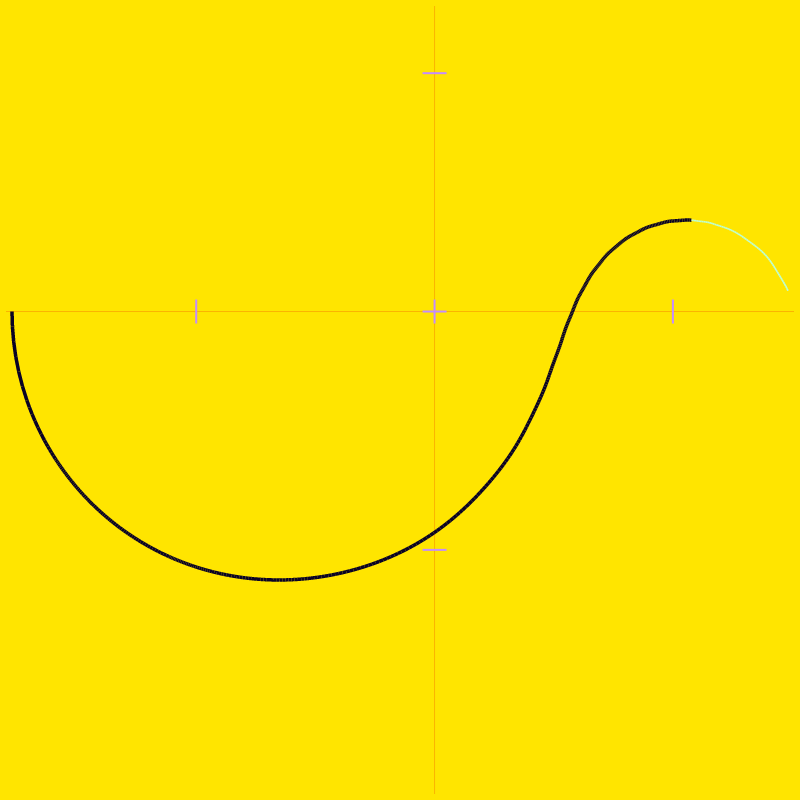
[C] - Toggle between a full graph and a partial graph.
[S] - Shows the current zeta function values.
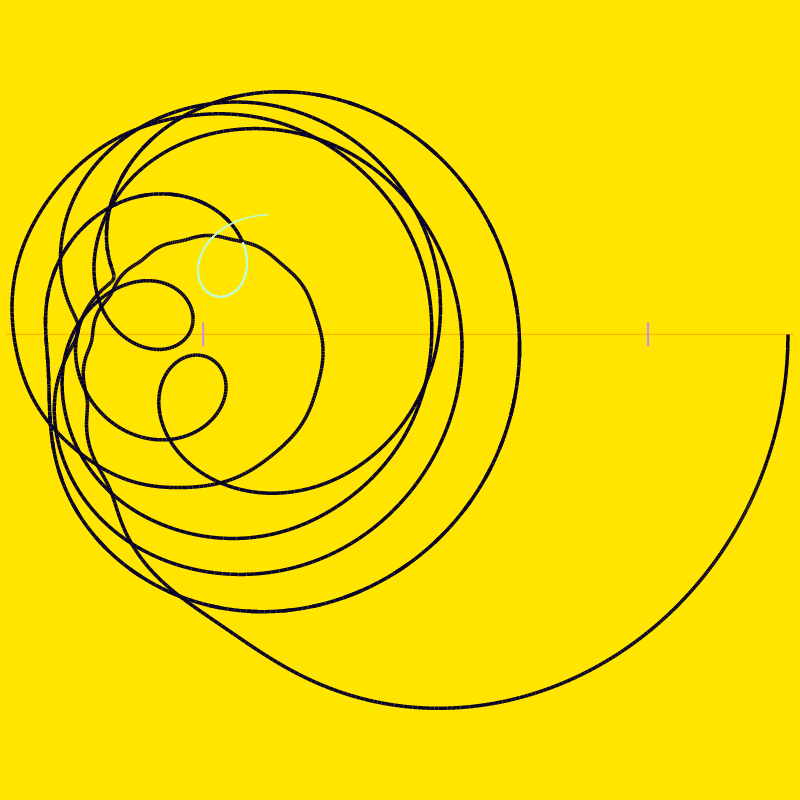
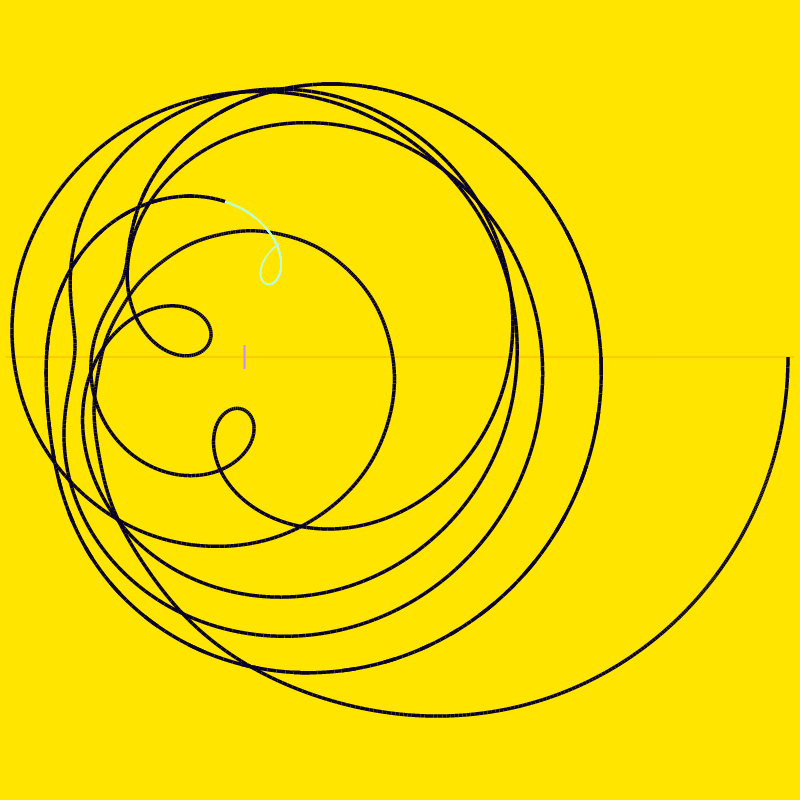
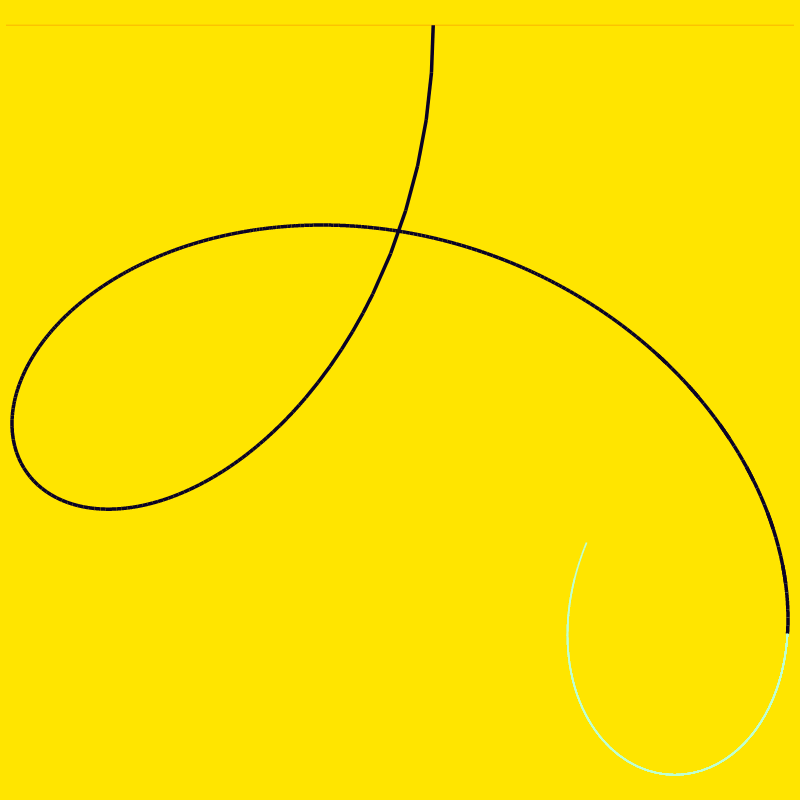
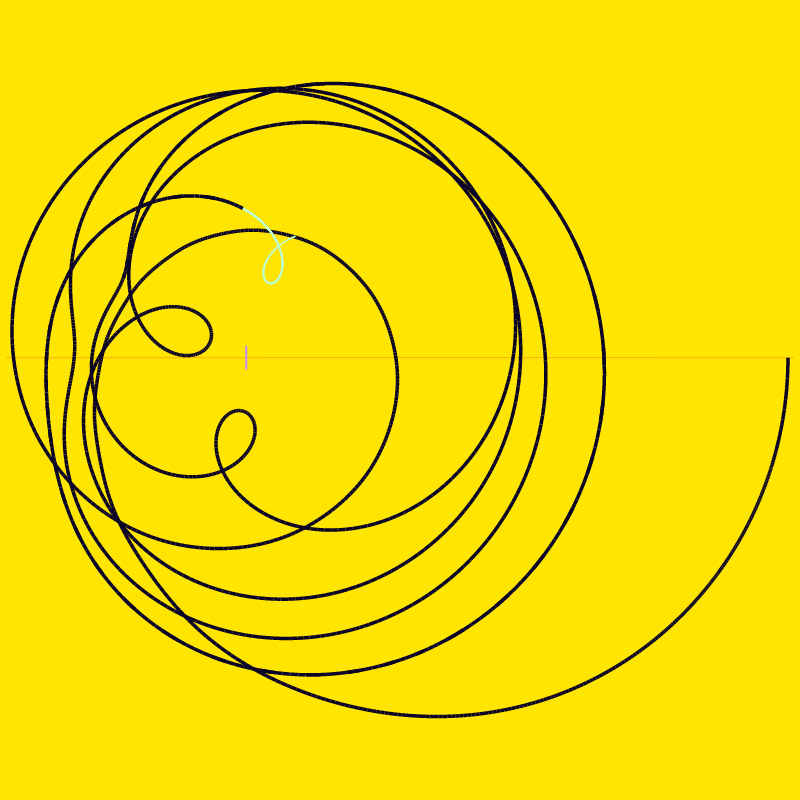
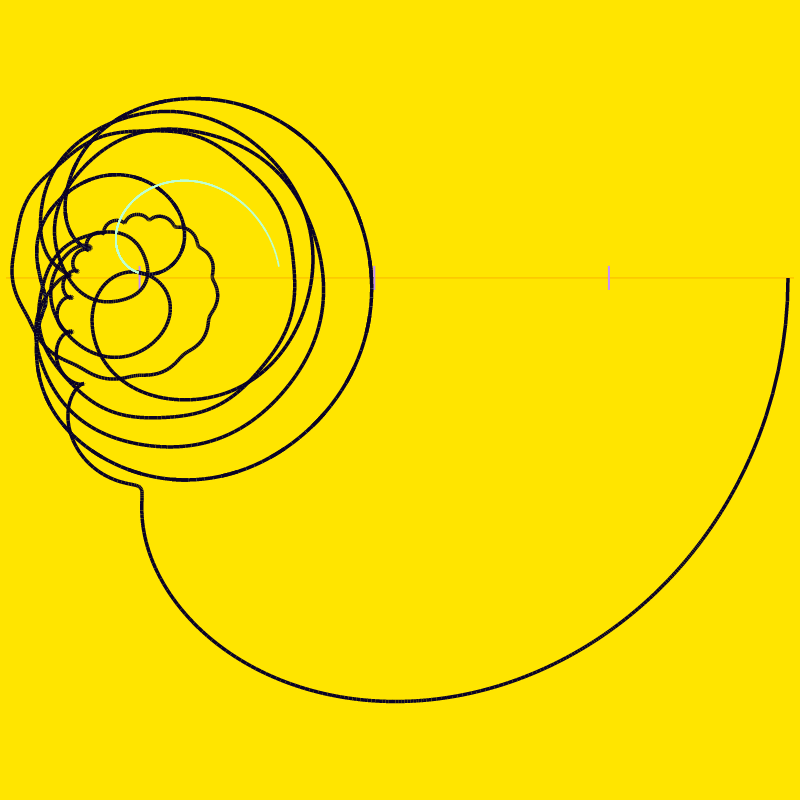
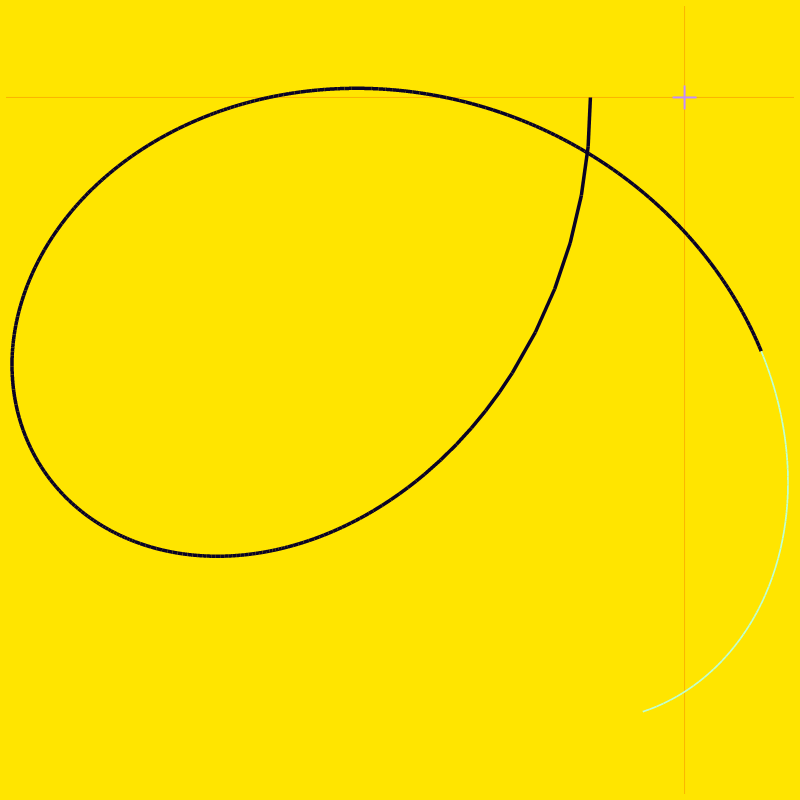
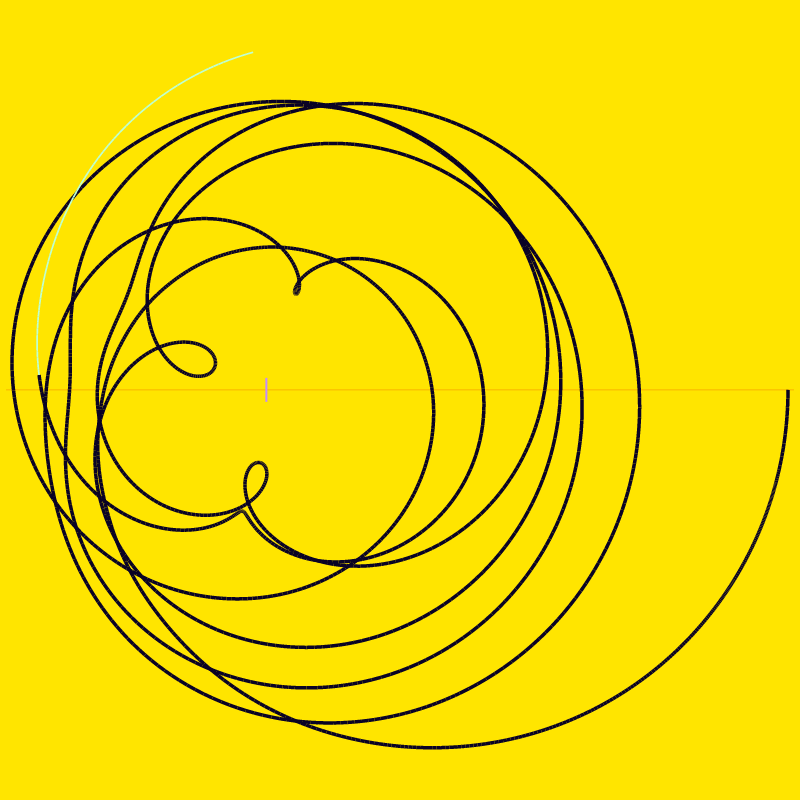
"B.R. & Hendrik - Mysterious Zeta Function"
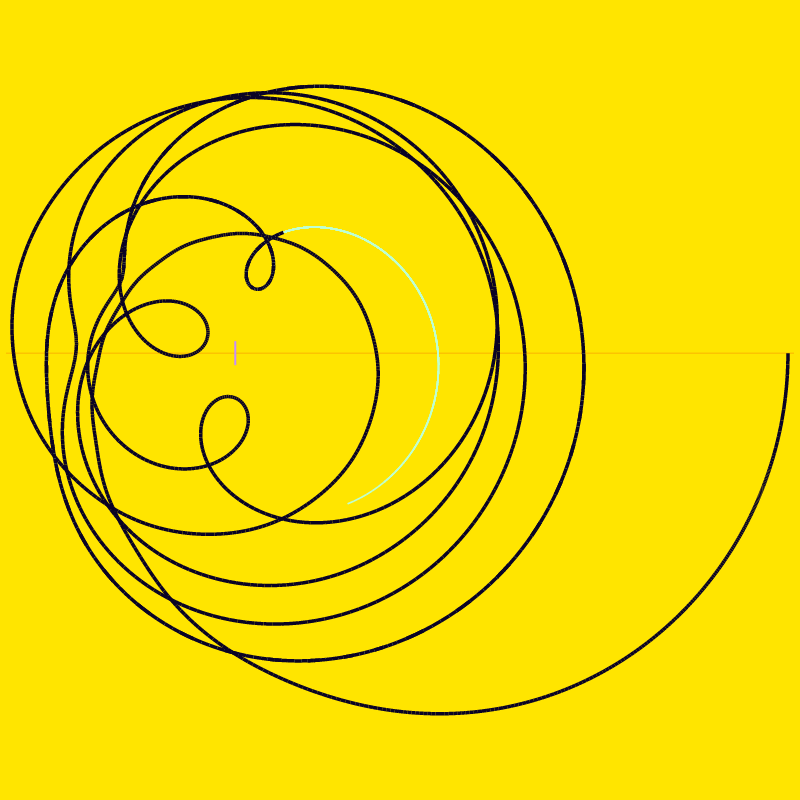
represents a bold expansion of my art project "Riemann Zeta Function," which has already been showcased on FXhash. This new project boasts an improved computational process, and more importantly, a groundbreaking innovation: it generates not only with a zeta-real value of 0.5 but with various other values as well.
"Yo, check it out! I've got an awesome idea to share: the closer the real part gets to the critical line (1/2), the rarer the image becomes. Isn't that boombastic?!"
Regarding "B.R. & Hendrik - Mysterious Zeta Function",
I have the same comments as I did for my previous project, "Riemann Zeta Function (Project #24965)".
The following points apply to both projects:
'Is the Graph of the Riemann Zeta Function considered art, similar to the works of famous artists like Picasso?'
'Whether or not the graph of the Riemann Zeta Function is considered art is subjective and open to interpretation. Some individuals might find the patterns and shapes displayed in the graph to be aesthetically pleasing and view it as a form of art, while others may not. Ultimately, the definition of art is a matter of personal interpretation and can vary from person to person. While the graph of the Riemann Zeta Function may have some artistic elements, it is not directly comparable to the works of artists such as Picasso, as the Riemann Zeta Function is a mathematical concept and not a traditional form of art.'
I'm currently studying the Riemann Hypothesis. My idea was to start by plotting the zeta function Z(1/2 + xi). I searched for an HTML example on Google but to no avail. 'So I have to expand my knowledge', I thought to myself. I need to better understand calculations with imaginary or complex values and find a way to plot the graph from all the formulas.
Wolfram-alpha provided me with relatively accurate Zeta values that I used as a reference to know if I was on the right track. There was also a lot of material for visual representation (i.e. drawn Zeta graphs) and many formulas. It was quite a challenge! But in the end, I got what I wanted: the Zeta graph.
I was then ready to extend the function so that it can be used for the entire real positive range.
Note !!!: I think my Zeta method is technically correct. However, the result can be so inaccurate that one would have to declare the results as incorrect (e.g. for real parts <0.2 / clearly visible).
I assume that this is an error that only has to do with the truncation of decimal values (including rounding errors).
But still, I do not know if my Zeta method is correct!
Especially if you use these html procedures for
serious mathematical work, be extremely careful!
Otherwise, I would simply like to offer you what I was originally looking for: "A ready-to-use solution to plot the Riemann Zeta graph." Best regards.
I have always enjoyed programming because it allows me to accomplish much more than I could with words alone.
49998 EDITIONS
•0 RESERVES
minted
9 / 49998
fixed price
0.25 TEZ
Lorem ipsum project longer longer
0.00001 ETH
Lorem ipsum project longer longer
0.00001 ETH
Lorem ipsum project longer longer
0.00001 ETH
Lorem ipsum project longer longer
0.00001 ETH
Lorem ipsum project longer longer
0.00001 ETH
Lorem ipsum project longer longer
0.00001 ETH
Lorem ipsum project longer longer
0.00001 ETH
Lorem ipsum project longer longer
0.00001 ETH
Lorem ipsum project longer longer
0.00001 ETH
Lorem ipsum project longer longer
0.00001 ETH
Lorem ipsum project longer longer
0.00001 ETH
Lorem ipsum project longer longer
0.00001 ETH
Lorem ipsum project longer longer
0.00001 ETH
Lorem ipsum project longer longer
0.00001 ETH
Lorem ipsum project longer longer
0.00001 ETH
Lorem ipsum project longer longer
0.00001 ETH
Lorem ipsum project longer longer
0.00001 ETH
Lorem ipsum project longer longer
0.00001 ETH
Lorem ipsum project longer longer
0.00001 ETH
Lorem ipsum project longer longer
0.00001 ETH
Lorem ipsum project longer longer
0.00001 ETH
Lorem ipsum project longer longer
0.00001 ETH
Lorem ipsum project longer longer
0.00001 ETH
Lorem ipsum project longer longer
0.00001 ETH
