Properties of Stars
written by dbob
Light is amazing!
"Yeah, Science!" Jesse Pinkman from Breaking Bad
You may be surprised to learn that nearly everything we know about the world around us (and the Universe) comes from light! For example, you are able to read this due to light being emitted from your screen that then enters your eyes and is processed by your brain. However, it goes much deeper than that. Light is emitted and absorbed by atoms (and molecules) and interactions mediated by light govern all physical, chemical, and biological processes. Light is the key to gathering, interpreting, and utilizing information.
Light is an electromagnetic wave
So, what exactly is an electromagnetic wave? Glad you asked. As the name suggests, it is combination of oscillating electric E and magnetic fields B. In the figure below you can see that these fields oscillate perpendicular to each other and propagate towards the right.
Waves are characterized by their wavelength, frequency, and the speed at which the wave travels. Wavelength λ is the distance for one complete oscillation (or alternately the distance between peaks). Frequency f is the number of oscillations per second (units are hertz, Hz).
Electromagnetic waves travel at the speed of light c.
This is an extremely fast speed! The sheer magnitude of this speed may be a bit clearer when expressed in terms of km/hr and mph.
The relationship between wavelength, frequency, and speed
The relationship between wavelength, frequency, and the speed of light is shown below.
Example: What is the wavelength in meters of an FM radio wave that has a frequency of 90.0 MHz? Note: 1 MHz = 1,000,000 Hz = 10⁶ Hz, and so the frequency is 9.00 × 10⁷ Hz.
Solving for wavelength gives
The Electromagnetic Spectrum
What we commonly refer to as light is only a tiny fragment of the full range of the electromagnetic spectrum. We encounter visible and invisible light every day. Walking outside during the day exposes us to the full range of visible, infrared (IR), and ultraviolet (UV) light. In addition, we are constantly bathed in longer wavelength radio and microwaves. Everyday uses of microwaves include cell phones, Bluetooth, Wi-Fi, satellite radio, radar, and of course, microwave ovens. Broadcast TV and radio utilize many of the longer wavelengths. On the shorter end of the range, a visit to the dentist, doctor, or long-range air travel gives exposure to x-rays. Exposure to gamma-rays (γ) is limited and due to natural and manmade sources of radioactivity.
How far away are stars?
Knowing the distance to a star allows us to determine its location relative to us and its place in the Universe. Additionally, as we will see a bit later, it also allows us to determine another important stellar property, a star's intrinsic brightness (luminosity).
The parallax method
There are several methods used to determine stellar distances. I will focus on the bottom rung of the distance scale ladder: the parallax method. This method relies on measuring small angles and using that information to calculate distance. The basic idea is to view an object from different locations and then measure the apparent shift (angle) of this nearby object with respect to other objects farther away in the background.
Clear as mud, right? Okay, let's illustrate this idea using your thumb and and your eyes! Extend your right arm out fully with your thumb pointing up. Next, close your left eye and line your thumb up with an object farther away (perhaps a potted plant on the other side the room). What happens when you close your right eye and view your thumb with your left eye? Your thumb appears to shift position, correct? How much your thumb's position shifts depends on how far away your thumb is from your eyes. Test it out by repeating everything with your thumb closer and you will notice that the shift is smaller when your thumb is farther away.
How is this applied to find the distance to a star? One method is to view a star field when Earth is in two different locations. Stars closer to Earth will shift more than stars farther away and the farthest stars will appear to not shift at all. We can see this in the figure above. Note that the distance from the Sun to the Earth is denoted as 1 AU (1 astronomical unit) and that half of the angular shift is the parallax. The measured parallaxes for stars are exceeding small. After using a small angle approximation and changing distance units we arrive at the simple distance formula below.
In this formula the parallax p is measured in arcseconds (1 arcsecond = 1/3600 of a degree) and distance is given in parsec (1 parsec = 3.26 light-year).
Example: What is the distance to a star if it has a measured parallax of 0.0150 arcseconds?
Which gives a light-year distance of
Distance in astronomy
| Unit | Value | Typically Used |
|---|---|---|
| 1 km | 1,000 m | within Solar System |
| 1 AU | 150,000,000 km | within Solar System |
| 1 ly | 63,200 AU | outside Solar System |
| 1 pc | 3.26 ly | outside Solar System |
How hot are stars?
Temperature
Believe it or not, temperature is related to how fast the atoms or molecules in an object are moving. The higher the temperature the faster they move. The Kelvin temperature is a measure of the true temperature of an object. The Kelvin temperature scale has no negative values and has a lowest possible temperature known as Absolute Zero (the temperature where all atomic/molecular motion stops). In most scientific applications, the Kelvin scale is used.
The temperature scales you may be more familiar with, Celsius and Fahrenheit, are related as shown below.
Blackbody radiation curves
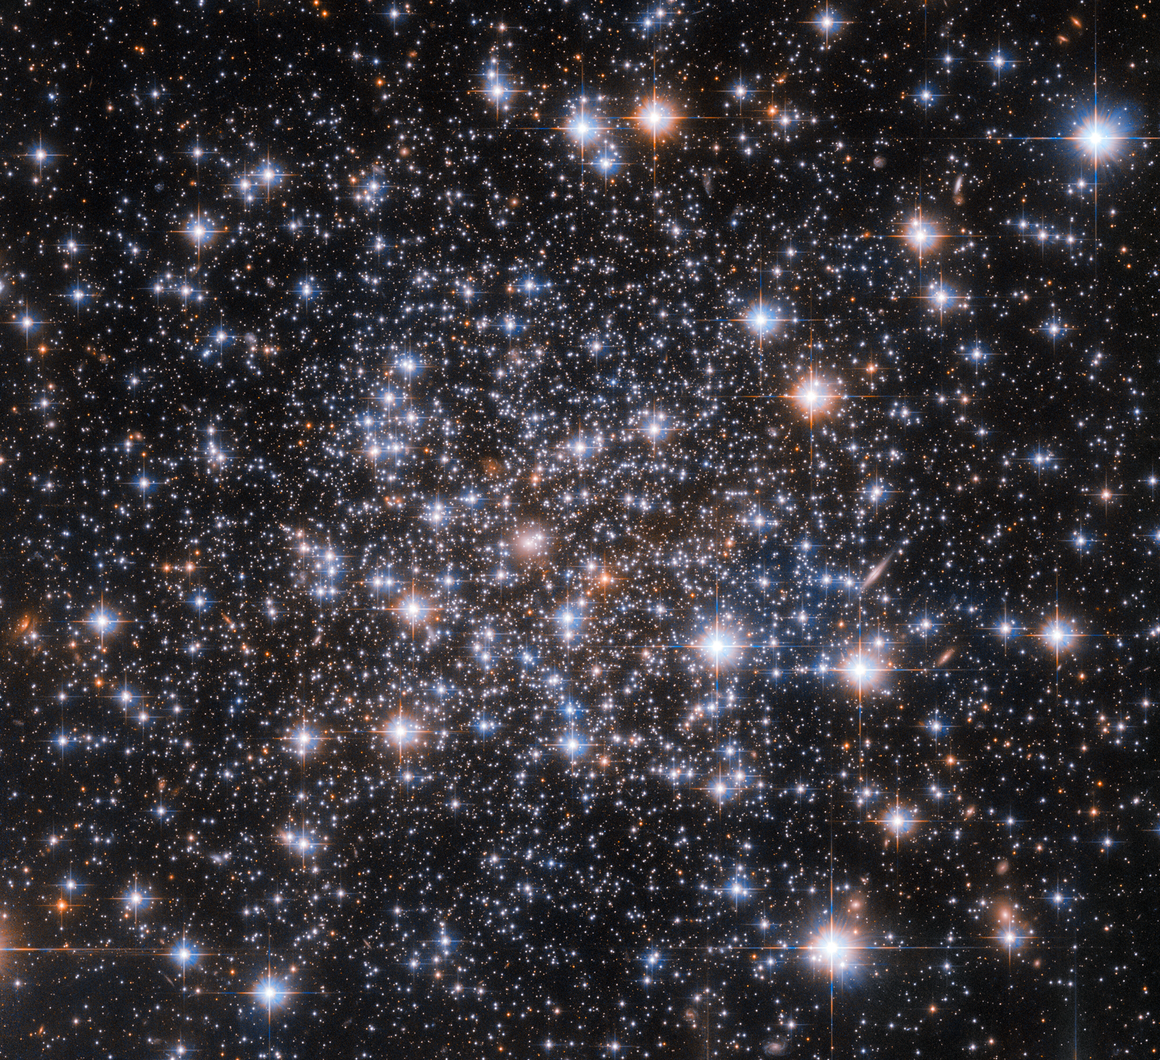
Stars come is a variety of colors (see the opening photo for this article). So why are some stars red, blue, yellow or another color? Temperature.
Dense bodies (solids, liquids, and gases under high pressure) emit a continuous spectrum of light that is referred to as blackbody radiation. The amount and type of light depends on the surface temperature of the emitting body. The temperatures shown below are in kelvin and the curves show that as the surface temperature increases the amount of light emitted increases (larger area under the curve), and the peak of the light curve moves to shorter wavelengths. The net effect is that objects with high surface temperatures emit more short wavelength light than objects with lower surface temperatures.
Wien's law
Wien's law gives a useful relationship between surface temperature and peak wavelength of blackbody radiation curves.
In this formula temperature T is in kelvin, and peak wavelength is in nanometers (nm). One nanometer is one billionth of a meter. As a frame of reference, the visible light spectrum runs from about 380 nm (violet) to 750 nm (red).
Example: What is the surface temperature of a star that shines most brightly at a wavelength of 724.5 nm?
Finally, as we will see a bit later, knowing the surface temperature of a star is a key input in determining the brightness and size of a star!
How bright are stars?
You may have noticed that some stars appear very bright, others less bright, and some are quite dim. There is an intrinsic brightness of a star (its luminosity) and an apparent brightness of a star. A truly bright star may appear to be quite faint if it is far away from the person observing it. When you look up at the night sky you observe the apparent brightness of individual stars. So how can we determine the intrinsic brightness (luminosity) of a star?
Luminosity and brightness
Have you ever bought a light bulb? The power rating you see on a bulb (for example, a 60 W bulb) is the luminosity of that bulb. Luminosity is the intrinsic brightness or power output of a luminous object. How bright a light bulb appears to be depends on its luminosity and your distance from the bulb. The same logic holds true for stars.
The apparent brightness B of a star decreases with distance. Notice in the figure below that when you double the distance (going from d to 2d) that the light spreads out to cover an area 4 times larger - this makes the star appear less bright - in fact it appears 1/4 as bright as it was at distance d. Likewise, when you triple the distance (going from d to 3d) the light spreads out to cover an area 9 times larger thus making the star appear 1/9 as bright as it was at distance d. Apparent brightness follows an inverse square law, meaning that it depends on 1/d².
Inverse square law relating luminosity, brightness, and distance
As mentioned above, apparent brightness decreases with the square of distance. The exact relationship is found below where B is apparent brightness, L is luminosity, and d is distance.
Example: What is the apparent brightness of a 100 W light bulb at a distance of 2.5 meters?
For the case of a star, it is the luminosity that we wish to determine. Rearranging the inverse square law gives the relationship below.
Example: What is the luminosity of a star if its apparent brightness is measured to be 1355 W/m² and its distance is found to be 1.50 × 10¹¹ meters?
The luminosity of this star is an amazing 383,000,000,000,000,000,000,000,000 watt - and surprise - this star is the Sun!
Stefan–Boltzmann law and luminosity
There is another luminosity relationship that comes directly from an analysis of blackbody radiation. The formula shown below shows luminosity's connection to the surface temperature T and radius R of a star. The constant σ is known as the Stefan–Boltzmann constant.
I won't show any direct evaluation of luminosity using this formula. However, I will make use of it in the next section to determine the size of a star.
How big are stars?
Our star, the Sun, is so large that its radius is 109 times that of Earth. Stars come in a vast range of sizes. Some stars are the size of cities, while at the opposite extreme, the largest stars are more than 1000 times the size of the Sun. How do we determine how big stars are?
The Stefan–Boltzmann law revisited
I finished the last section by mentioning the Stefan–Boltzmann law for luminosity - mainly as a teaser for this section. My bad.
Because stars come in such a wide range of sizes, temperatures, and luminosities, it can be more convenient to express all of these quantities relative to the Sun's parameters. To do this we can form a ratio of luminosities using the Stefan–Boltzmann formula. After canceling out common factors we get the result shown below.
Next, after doing a bit of algebra we can solve for the ratio of radii and get the formula shown below.
This relationship can be used to determine the relative size of a star just by knowing its surface temperature and luminosity as found using the methods discussed earlier.
Example: What is the radius of a star if it is 25 times brighter than the Sun and half as hot?
And so this star is 20 times larger than the Sun. Notation alert: most astro-texts use R⊙ and T⊙ notation for the radius and temperature of the Sun.
How much mass does a star contain?
How much stuff - mass - does a star contain? How do we weigh a star? Fortunately, gravity comes to our rescue because objects with mass are attracted to each other and occasionally orbit each other! Large scale star surveys reveal that most stars form and hang out in groups. Many star systems are binary systems - meaning that two stars are locked into a mutual gravitational dance (see a few examples below).
Newton's version of Kepler's third law
Isaac Newton is famous for his laws of motion, law of gravity, inventing calculus, and many other endeavors! Using his laws of motion, gravity, and mathematical techniques, he was able to derive and explain Kepler's laws of planetary motion. Newton's generalized version of Kepler's third law deals with massive objects orbiting one another. Newton's version can be applied to a wide range of orbiting bodies: planets, stars, black holes, and even galaxies! The formula shown below is for two objects, with masses M₁ and M₂ , in mutual orbit with average distance a that complete one orbit in time period P. In this formula mass is measured in solar masses (1 solar mass = mass of the Sun), distance is measured in astronomical units (AU), and time in years.
This formula allows for the direct determination of the value of the combined masses M₁ + M₂ simply by measuring their average distance and orbital period. If one of the masses is known, then the other mass may be calculated using this formula.
This method can be used to determine the mass of Earth by measuring the average distance of an orbiting satellite and its time period for one orbit of Earth. This method has been used to determine the masses of the planets in our Solar System, the Moon, the masses of stars, and the masses of galaxies.
Example: What is the mass of a star if it is orbited by another star that has 3.0 times the mass of the Sun, takes 2.0 years to complete one orbit, and averages 4.0 AU away from its companion star?
And so the mass of this star is found to be 13 times the mass of the Sun.
Composition - What are stars made of?
Once again light comes to the rescue! Light is emitted and absorbed by atoms and molecules. With careful analysis we can tease out the unique light signatures of specific types of atoms and molecules and thereby determine the composition of stars, nebula, and even the atmospheres of other planets.
Light dispersion
The first step in the analysis of light is to separate it into its different wavelength components. This separation is called dispersion and you have witnessed this phenomenon if you have ever seen a rainbow or light passing through a prism. When light passes through a prism different wavelengths are bent (refracted) by different amounts and the net effect is to spread out the light by wavelength. A similar process occurs with rainbows with raindrops playing the role of the prism.
Emission spectra
In our earlier discussion about blackbody radiation, we saw that dense bodies (solids, liquids, and gases under high pressure) emit a continuous spectrum of light. Under these high-density conditions only temperature plays a role. However, under low-density conditions - specifically, a low-pressure gas - the individuality of atoms and molecules becomes apparent. These low-density conditions exist in the outermost atmospheres of stars and in clouds of interstellar gas.
Under low-density conditions excited atoms (and molecules) emit unique wavelengths of light. These light signatures, emission spectra, are akin to light-fingerprints that uniquely identify the source of the light. The technique requires gathering light, then passing the light through a prism (or diffraction grating), and finally, comparing the patterns to samples here on Earth.
Example: Below is shown the emission spectra of the first four elements in the periodic table of elements: Hydrogen, Helium, Lithium, and Beryllium. The scale is in nanometers. Notice that the location, and pattern, of lines is unique to each element. Composition is determined when the spectral lines from an unknown sample match known emission spectra.
Absorption spectra
In practice, it can be difficult to directly apply the emission spectra technique to identify the composition of stars. Why? The amount of light coming from a star's higher density surface simply overwhelms any visible emission spectra. Thankfully, that's not the end of the story.
As discussed in earlier sections, stars emit a continuous spectrum of light based on their surface temperature and the outer atmospheres of these stars (lower-density regions) emit unique wavelengths of light. Atoms in these lower-density regions also absorb the exact same unique wavelengths of light. The net result is star's continuous spectrum has gaps where atoms in its outer atmosphere have absorbed specific wavelengths.
Okay, but if the atoms in the outer atmospheres of stars absorb and emit the same unique wavelengths of light, then why would this result in a continuous spectrum with absorption gaps? Good question! After light absorption the atoms emit light in random directions - this results in less light at those specific wavelengths being emitted along any particular line of sight. The net result is dimmer or darker spectral lines at the unique wavelengths specific to each type of atom.
Example: Below is shown the absorption spectra of the first four elements in the periodic table of elements: Hydrogen, Helium, Lithium, and Beryllium. The scale is in nanometers. Notice that the location, and pattern, of lines is the same as shown in the earlier emission spectra example. Composition is determined when the spectral line gaps from an unknown sample match known absorption spectra.
What is the speed and direction of motion of stars?
Have you ever been pulled over for speeding? How did the police officer know your speed? They may have used a radar gun - a device that measures the shift in wavelength of microwaves bounced off of your car. The bigger the shift, the higher the speed. This speed-related wavelength shift is called the Doppler effect. The Doppler effect occurs for both sound waves and light waves.
Astronomers measure speed-related wavelength shifts by comparing absorption spectra from moving stars to samples here on Earth. As will be shown below, this allows the determination of radial speed (and direction) relative to Earth.
Blue-Shifted Example: Directly below are the observed absorption spectra of hydrogen for the following cases: not moving, a star moving toward you at 3,000 km/s, and a star moving toward you at 30,000 km/s. Notice that the pattern of spectral lines shift toward shorter wavelengths when a star is approaching and shift more with higher speed. Wavelength shifts toward shorter wavelengths are referred to as blue-shifts.
Red-Shifted Example: Directly below are the observed absorption spectra of hydrogen for the following cases: not moving, a star moving away from you at 3,000 km/s, and a star moving away from you at 30,000 km/s. Notice that the pattern of spectral lines shift toward longer wavelengths when a star is moving away and shift more with higher speed. Wavelength shifts toward longer wavelengths are referred to as red-shifts.
The Doppler formula
Speed is calculated with measured Doppler shifts using the formula below. In this formula λ is the shifted wavelength, λ₀ is the unshifted (non-moving) reference wavelength, c is the speed of light, and V is the calculated speed.
Example: What is the speed, and direction of motion, of a star if the measured wavelength of a specific spectral line from this star is 339.84 nm and the same spectral line here on Earth is measured to be 325.11 nm?
First calculate the ratio of wavelengths.
Next, use this value to calculate the speed.
That means that this star is moving away from Earth at a speed of 4.43% of the speed of light. How fast is that? Recall from earlier in this article that the speed of light is extremely fast.
This gives the speed of this star as
Wow! This star is really moving! A speed of 13,290 km/s is 47.8 million km/hr (which is roughly 29.7 million mph)!
That's all for now
I hope you enjoyed this little bit of science related to stars! 😎
About the author
I'm a science professor and generative artist. I will be releasing more science-related generative art very soon! Below are my first four fx(hash) projects. Stay tuned for more to come!