The River
written by bejuco
Rivers are complex lifeforms. They have life cycles, body parts, and a long geological history. They also have a deep relationship with the cultures and civilizations that flourish along side them.
Recently I participated in a digital history project about the Orinoco river as a designer and developer. Helping to create an interactive narrative, I understood how this great mass of water connects different people and products. And how rivers perform crucial economic, social, and ecological services.
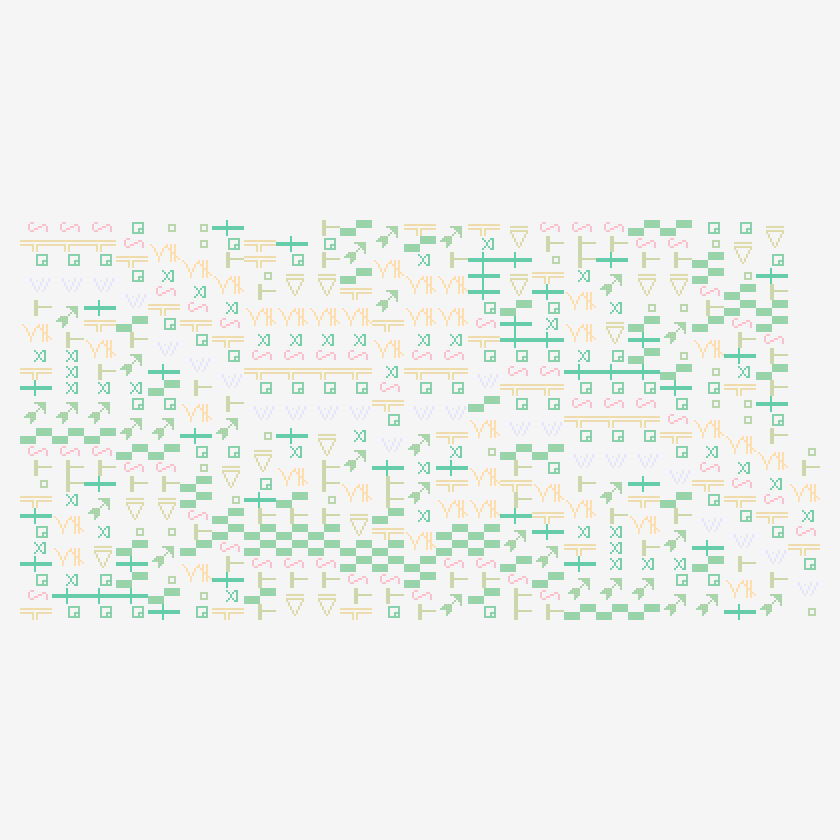
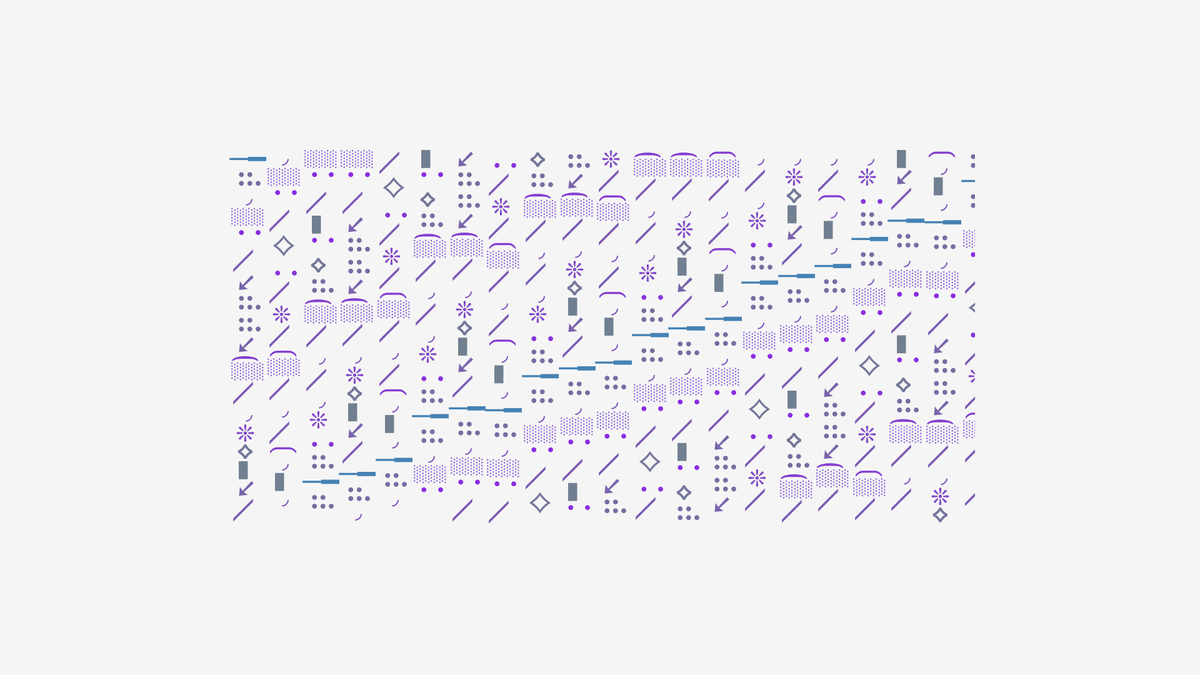
Working with GIS and web libraries like MapLibre GL JS made me eager to create generative pieces using Colombia's open hydrography data. So here is the first one: a hard data flattening and mapping to visualize digits, points (.), and lines (-) as different symbols to create patterns.
This is the step-by-step of the process:
- Obtain a random feature from the geoJSON file. I decided not to keep the name of the feature because not all of them have it. For a next project maybe I'll use only named rivers.
- Get the latitude and longitude coordinates of the feature.
- Flat the coordinates to create an array of strings.
- Offset the array by moving the first element of the array to the last position.
- Map every string to an equivalent element from another array formed by random glyphs.
- Create a new <span> element in the canvas with each glyph. Every n number of elements the canvas has to be cleared. Having a large number of nodes in the DOM is very bad for performance and some features have more than 10K strings in the final array.
The resulting pieces are hard and sharp abstractions of a river. A kind of first-level exercise to understand how to use this kind of data and what is possible to create with it. It is worth mentioning two references that had a great influence in how the project looks and feels.
- MapSCII : a crazy node.js project to render vector tiles using Braille and ASCII characters in the terminal.
- The Mesoamerican Codices : manuscripts made by hand by different indigenous cultures. In a recent visit to Mexico I had the opportunity to see the Codex Boturini in person. Most of the codices are really long narrow strips that illustrate different topics like rituals, stories, and cartographic data.
project name project name project name
I was a bit surprised to see evolving and diverse compositions. I like to think they represent the diversity present in rivers ecosystems and the hypnotic visual elements that catch our eyes when we see the ever-evolving flow of water.
As in the Muraka piece, I wanted to link the project with initiatives around the world that try to make a positive impact. In this opportunity I'll donate 25% of the sales to the OpenStreetMap Foundation. Without the effort of people that nourish OSM, this process wouldn't be possible in the first place. More on how to use OSM data here and how to support the foundation here.
I really hope we keep building and supporting projects that maintain the flow of relevant, transparent and open data. I'm also really excited to see where the use of this kind of data takes my creative process. I'd also like to use the Redeemables feature for future projects.of fx(hash)
Thanks for reading, here's a very good song about a river 🏊: