Methods of Dispersal
written by mandybrigwell
Beginnings
Methods of Dispersal was released on the 17th of September, 2020, but it originates from the 25th of July, beginning a simple tweet:
- 1. Source image is created and slightly blurred.
- 2. Random points are chosen from the source image.
- 3. An opacity is determined from the source point.
- 4. Maths happens.
- 5. A point is plotted as a small patch of variably-sized pixels.
- 6. Repeat.
As it happens, my whimsical ‘Step 4’ allows for a whole range of exciting events: the shaping of random processes between curated values, spreading a subtle dance between order and chaos across the canvas. It extends my fascination with dot-based rendering, and the spattered texture one can achieve by chaining the multiplication of random numbers between 0 and 1, altering the size of points and their opacity based on their distance from a central point.
The Generative Process
Step 1: Generating a Source Image
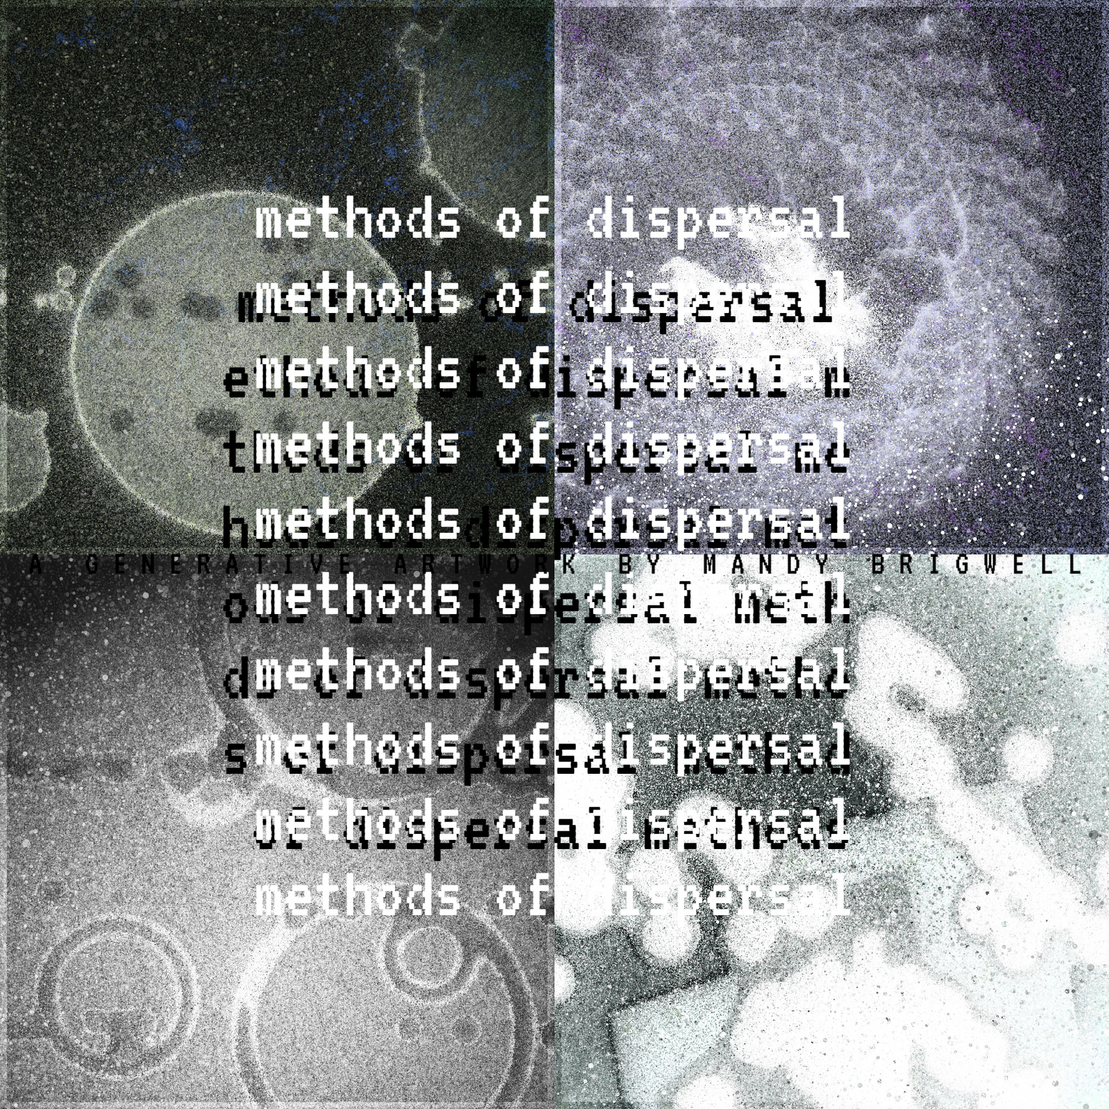
First, a source image is created. To begin with, these were simple sine waves, bouncing across the canvas, and an overlaid, slightly-opaque rectangle. As the piece progressed, they expanded into a variety of shapes: in the finished piece the source image may be Fibonacci-based, sine-, line-, ellipse-, or rectangle-based. It will be faded and slightly distorted. It may be rotated. It will look something like these.
The two Fibonacci-based images are clearly visible—those spiralling ones. One has closely-filled dots, the other is slightly more open.There are a couple of densely-filled images, as well: the two at the top- and bottom-left. One might expect these pieces to produce dense outputs, but this is dependent on the next phase of the generation process, meaning that the more open, white-space-filled images, such as the bottom-right, have as much opportunity to produce interesting final renders.
Step 2: Generating a Mapping Function
This is a much simpler step. Initially, I begin with ten values, ranging from 0 to 1. The black line overlaid on the source image below shows a typical set of ten values.
Later, the mapping function became variable, with some mappings ranging from 2 to 90 values, expressed as ‘complexity’ in the piece's fx(hash) features. No value is particularly ‘better’ than any other, and there is no weighting to the random numbers.
These mapping values take the greyscale value of any point on the starting render, and map it to a different greyscale value. The top-left, in the examples below, decreases overall as the grey-intensity increases, whereas the bottom-left is more of a rough bell curve. Grey values in the middle will be emphasised, whilst those around it will appear lighter.The top-right mapping function will produce a striated image, as a sweeping greyscale curve would lead to spikes in near-adjacent values.
Step 3: Rendering
With a source image in hand, and a set of mapping functions, locations are chosen on the source canvas, shifted only slightly by Perlin noise and a slight fading towards one or more edges, possibly with rotation applies. The value from the source image is then manipulated according to the mapping function and further manipulated with chains of multiplied random numbers, before being placed on a larger buffer canvas and finally rendered to the screen.
This rendering process is slow and progressive—it takes place over three hundred and sixty frames, with between 568 and 1024 points being added per frame. Other effects are also generated: some shading, distortion, overlaid marbling and a contrasting colour. This image shows the relationship between the source image, mapping function, and the final render.
In other renders, the mapping function may make it hard to see a relationship: rotation and distortion may make the two images seem very different. Spirals and swirls abound from Fibonacci-based source images, whilst twirling sine-waves or twisted circles appear from the more polygon-based sources.
Variations
Variety is key, but restraint brings cohesiveness. Repeated test renders of sixty-four images not only taxed my machine's fans, but gave me a suitable variety of interesting images, whilst maintaining an appropriate distance from the outliers: images that were too dark, too light or simply uninteresting. Occasionally, a piece appears that would be better just a little lighter, a fraction darker, or a little less distorted, perhaps, but such are the whims of generative art. Ultimately, an artist can only nudge and shape the random process; the vagaries of mathematics are still in control.
In an effort to wrestle back some control, three render modes—named whimsically as ‘Equality’, ‘Intensity’ and ‘Balance’—are available, whilst the colour palettes take inspiration from Brian Eno's use of essential oils and chemicals in his Generative Music applications. ‘Vetiver’, ‘Neroli’, ‘Patchouli’, ‘Benzene’ and ‘Bergamot’ produce images ranging from monochrome to vivid color, the latter being somewhat rare.
The Last Days
‘Methods of Dispersal’ fits into the apocalyptic universe of ‘The Last Days of Fire and Steel’, joining ‘Mapped Orbits for Unbound Electrons’, ‘Boundary Conditions’ and ‘Imperfect Images of Transuranic Elements’, as containing snippets and fragments of text that hint at a dark and desolate future.
Aside from the piece's description—the short piece of writing reproduced at the beginning of this article—there is nothing more to be found in ‘Methods of Dispersal’s code. A single hidden feature is not so hidden after all: in full screen type a capital M with shift-m to view the source image, and its associated mapping function.
