Marketplace Analysis V1
written by Extracurricular...
This short article analyzes some fxhash marketplace data. If there is general interest in this sort of article, I may consider making this into a series. Let me know if you find this sort of thing useful.
In this article, I explore the relationship between the "proportion of unique minters" and the secondary sales volume. An obvious question might be, what is the proportion of unique minters? To calculate the proportion of unique minters, we simply take the total number of unique minters (those who collect a piece on primary) and divide it by the total number of iterations minted. For example, let's consider a project, Project A, that has 10 editions, all of which are minted on primary. Bob mints 2 tokens, Alice mints 5 tokens, and Stanley mints 3 tokens. Then, the proportion of unique minters would be 3/10 = 0.3, as there are three unique minters (Alice, Bob, and Stanley) and 10 tokens minted on primary. If the proportion of unique minters is equal to 1, this means that no single wallet minted more than one token from the project. Obviously, it is quite rare to have a proportion of unique minters equal to 1. However, there are quite a few projects that have a proportion of unique minters greater than 0.9.
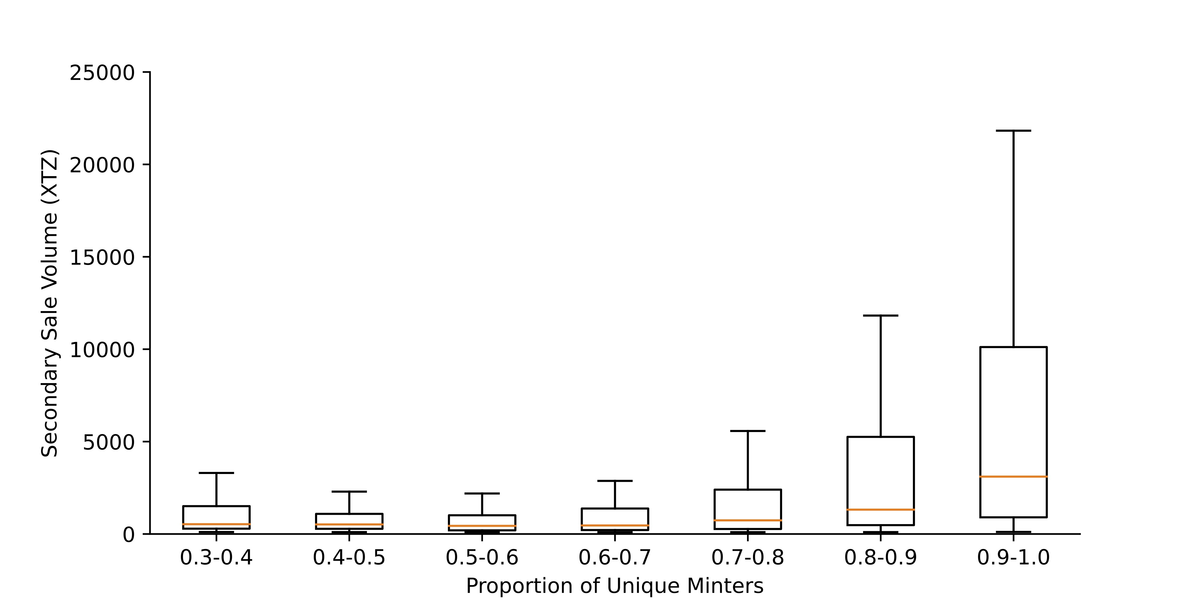
My hypothesis was that as the proportion of unique minters increases, the median secondary sales volume will increase. To test this hypothesis I aggregated all interactions with the fxhash v2 contracts using tzkt. As a result, v1 projects are excluded from my calculations. I exclude any project that has less than 100 XTZ in primary sales revenue or less than 100 XTZ in secondary sales. In the graph below, a box plot is shown for each range of the proportion of unique minters. For those unfamiliar with box plots, the orange line in the middle (vertically) of each box represents the median value, the top and bottom of the box show the upper and lower quartile, respectively. By observing the positioning of each box, and the line in the middle of each box, we can see that as the proportion of unique minters increases, secondary volume typically increases. Based on my reading of the results in the graph, this hypothesis is validated.
Intuitively, these results seem to make sense. When a collector only has one iteration from a project, it is likely more difficult to part with this token. In aggregate this would decrease selling pressure. In contrast, when most collectors own multiples from a project, it is increasingly likely that some of these were purchased without the intention to hold them long term, increasing selling pressure.
Of course, there are limitations to this analysis. First, in many instances multiple distinct wallets belong to one collector. In this analysis, we assume a 1:1 relationship between wallet and collector. Clearly, this is not true, as many collectors have multiple wallets, however, I would argue that this is the exception and not the rule. Furthermore, it was beyond the scope of this analysis to try to cluster wallets that belong to the same collector. Second, as we can see by the size of the boxes (increased box size indicates high variability), there is no guarantee that a high proportion of unique minters will entail a prosperous secondary market. This should be fairly obvious, as collectors often make decisions based on aesthetics, without consideration for any analytic measures or metrics. As a final note, none of this constitutes financial advice, I am just sharing my interpretation of the data I collected in the hopes it will prove useful or informative to others.