Exploring Price Dynamics in the Contrapuntos Market
written by Aurelian
Author's Note: Before we get into the analysis, I just want to take a moment up front to thank each and every one of you who shared and supported my previous article "Exploring Rarity in Contrapuntos". The response was more than I could have hoped for and I'm touched that my work was interesting to so many of you. Hopefully it's just the beginning!
In this piece we'll be looking at some interesting dynamics that have evolved within the market for Contrapuntos over the past year and a half. I went through and pulled data for each of the 376 sales that have happened in the time frame between publishing (11/13/21) and present (2/12/23) and then ran some analyses to see what, if anything, that data could tell us.
I'm going to break the article down into four sets of analysis:
- Overall Trends : a graphical view of the Contrapuntos market as it has evolved over time
- Setting New Highs: a look at some of the pieces that have set major new All Time Highs for the project
- Sales By Trait : an analysis of sales price versus trait (e.g. which background color has the highest average sales price?)
- Value Vs. Rarity: an exploration of what (if any) impact relative rarity has on sales price
Some quick notes on methodology before we dive in:
- I'm manually compiling this data, so apologies in advance if there are typos or transcription errors
- The analyses in this article join subjective data about feature distribution (defined by me in my previous article ) with objective market data pulled from the Tezos Block Explorer
- I used MicroStrategy Workstation (old habits die hard) to create the visualizations and on-the-fly metrics and calculations that are used throughout - thanks Michael!
- Although many say "1 tez = 1 tez", I've chosen to dollarize the sales figures using the market price of Tezos at the time of the transaction (as reported by tzkt.io)
- Finally, I'll reiterate that nothing here is meant to be financial advice, it truly is for fun and entertainment purposes only
Overall Trends
A lot has changed since Marcelo first published Contrapuntos in November 2021; to name a few, we've grown tremendously as an ecosystem, we've seen 376 individual Contrapuntos sales, and the price of Tez has fallen precipitously (before rebounding slightly)...so what does all that mean for how the project has done in terms of USD valuation?
The graph above charts the average sale price (converted into USD) for each day on which there was at least one Contrapuntos sale. To me, there are two big takeaways from this chart:
- The market for Contrapuntos has been highly volatile in USD terms; seeing at least 8 visible run ups and draw downs since launch
- Despite the fluctuations in Tez value, trading volumes, and overall volatility in cryptocurrency markets, the average sale price of Contrapuntos has held up remarkably well over the past year and a half and exhibits a strongly positive overall trend
One other point that I think is interesting when we look at the overall market dynamics is the role of the price of Tez. My hypothesis going into the analysis was that low Tez prices would result in sale prices going up in Tez terms, but that USD equivalents would be flat or down. In reality (see chart below), 9 of the 10 highest USD value sales in the history of the project occurred with sub-$2 Tez (the 10th clocking in at $2.04/Tez). I'm not quite sure what to make of this, but it does seem to indicate that the market for Contrapuntos held up well in a broader crypto bear market (perhaps due to a desire to consolidate on "grails" within the platform).
Setting New Highs
If we look back over the history of the project so far there are several moments where there is a clear jump in price and a new all-time high is set. Below I'll highlight a few of the pieces whose sale have helped meaningfully shape the market.
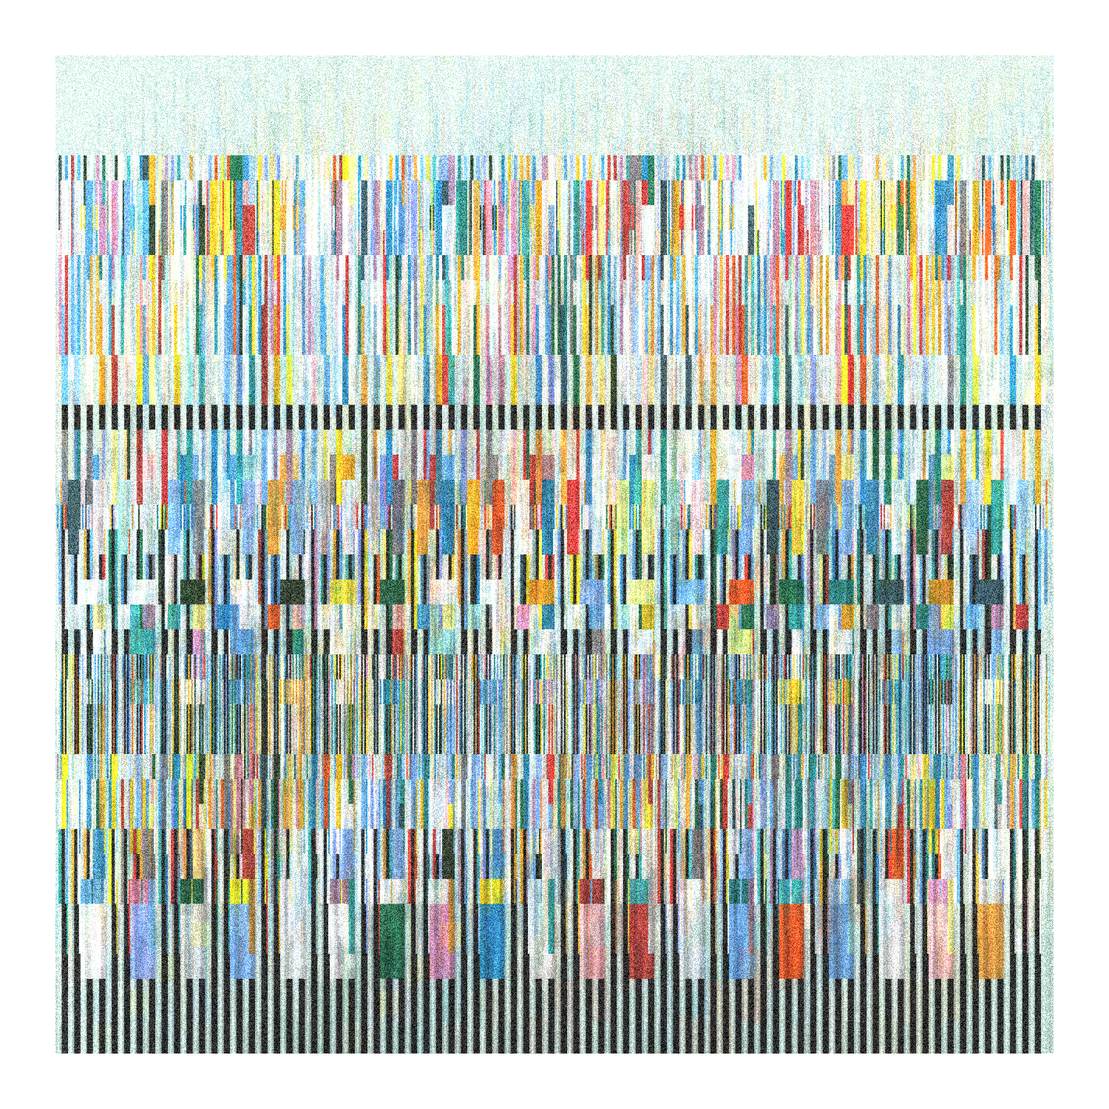
Contrapuntos #534 sold for 65 Tez (~$320.66) on 11/22/21
This was the first time a Contrapuntos sold for a significant premium (172.06%) over the previous ATH. The piece is a "tight", blue background iteration that is a pristine example of the feature that I refer to as "Temporal Pattern".
project name project name project name
Contrapuntos #346 sold for 185 Tez (~$1,023.90) on 11/30/21
This time we see a jump of 43.86% from the previous ATH - and break the $1,000 mark for the first time. The piece is a "wide", white background iteration that delivers strong, distributed blocks of colors.
project name project name project name
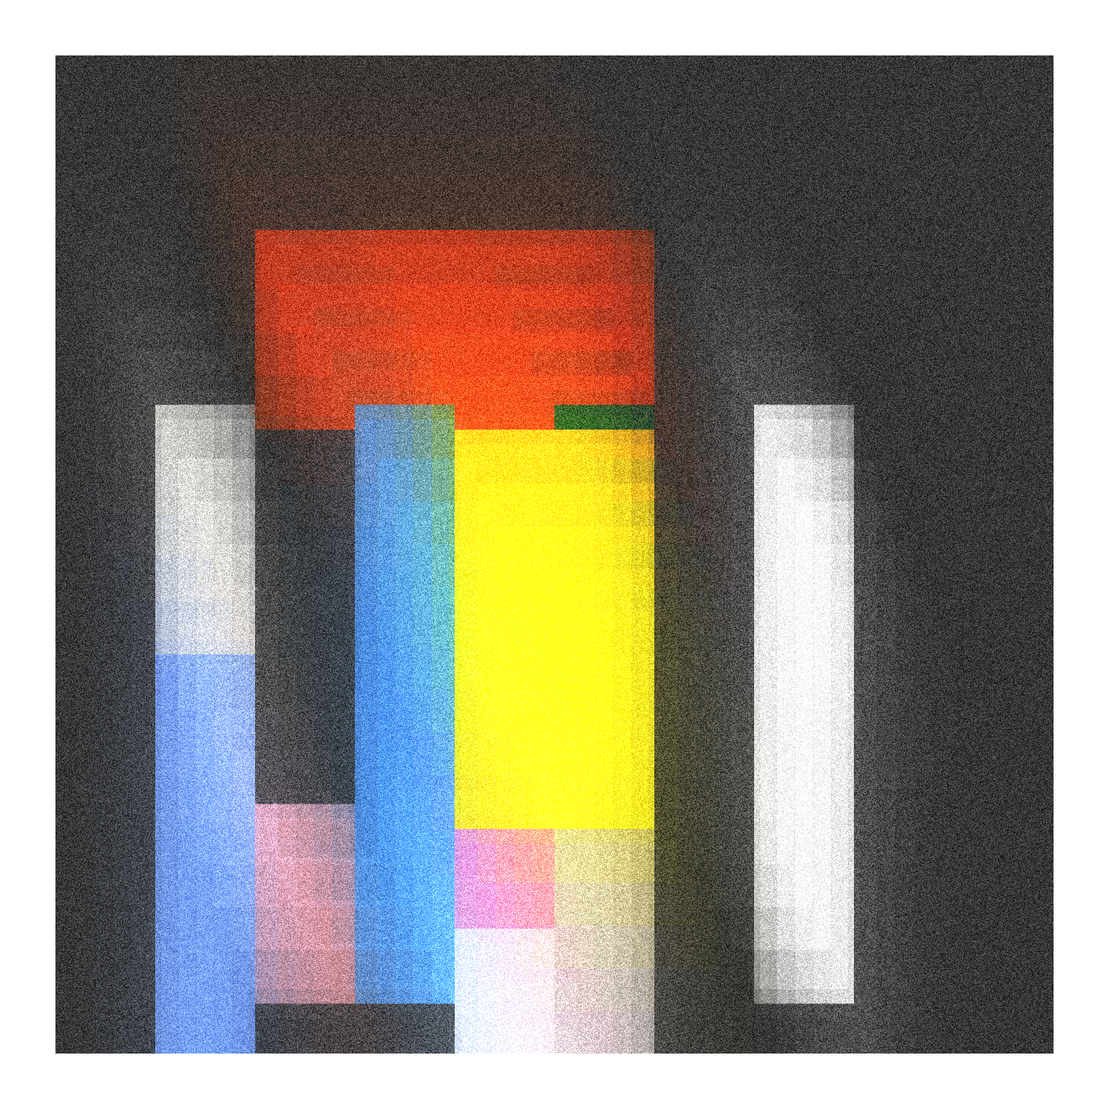
Contrapuntos #69 sold for 469 Tez (~$2,115.64) on 12/14/21
When Contrapuntos #69 sold for 469 Tez (eye roll) it represented a 31.93% jump in ATH. The piece is an "extra wide", black background iteration that has a strong visual focal point and is - at least to me - absolutely stunning.
project name project name project name
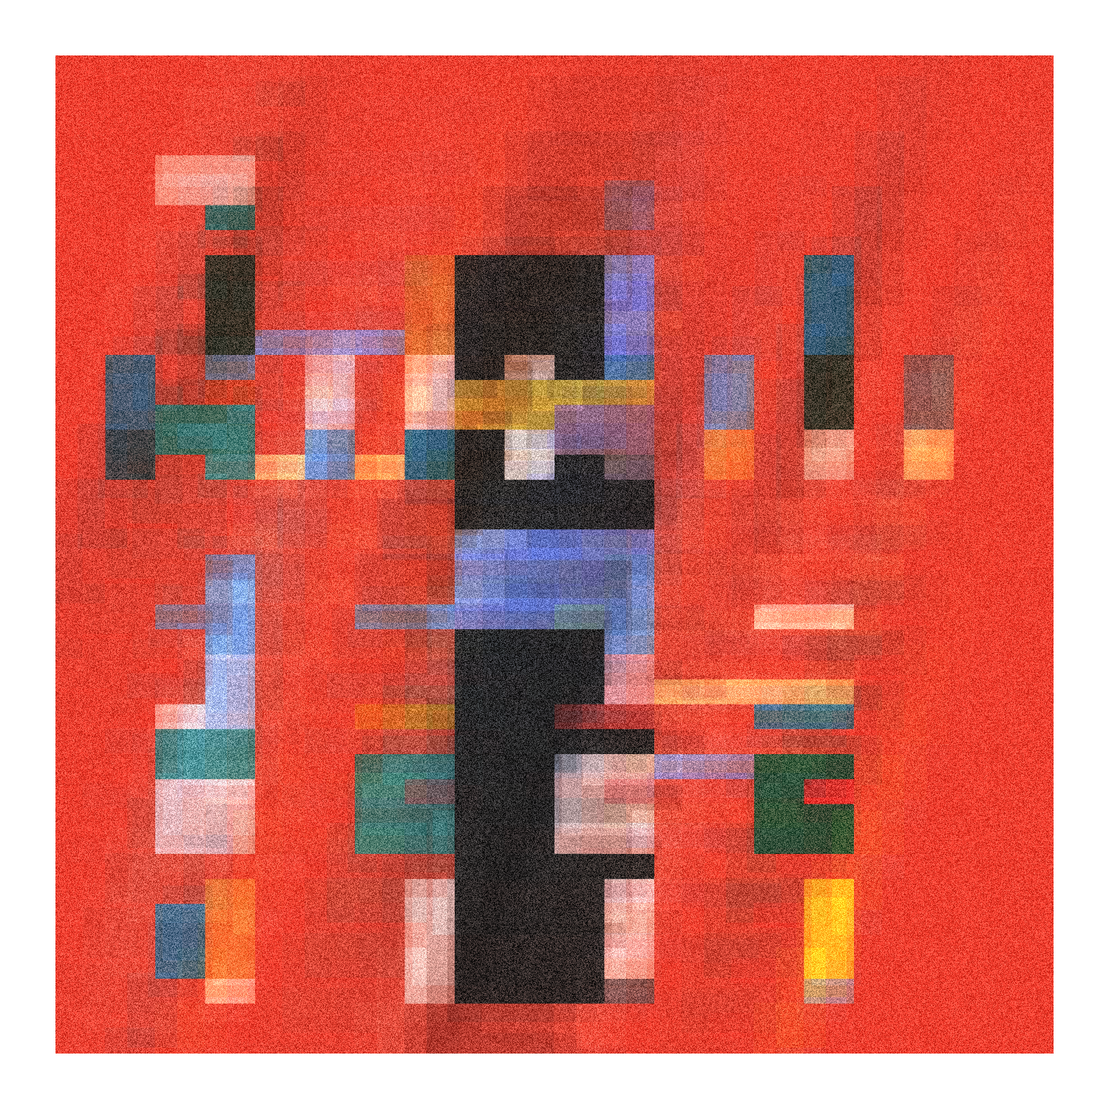
Contrapuntos #250 sold for 4,000 Tez (~$4,028.77) on 11/24/22
When Contrapuntos #250 sold for 4,000 Tez it was a massive jump in ATH denominated in both Tez and USD; representing a 31.6% jump in the ATH for USD valuation. The piece is a "wide", red background iteration that has a defined monolith as it's focal point.
project name project name project name
Sales By Trait
In my previous article, I explored the distribution and relative rarity of five core traits: Background Color, Compositional Spacing, Temporal Pattern, Focal Point, and whether or not an output has a Monolith (for clarification, all "Monoliths" are counted as having a Focal Point, but not vice versa). What we'll do in this section is explore what, if any, difference we can see in terms of how the market has valued these individual traits thus far.
I'm going to drop each of the charts down below (skipping the Monolith feature for now, since there have only been 8 total sales involving one) and then do a write up highlighting the most interesting findings below.
Background Color: each piece has one of six possible primary background colors
| Background Color | Number of Sales | Average Sale Price (USD) | Difference from Overall Average |
|---|---|---|---|
| Black | 46 | $1,248.48 | 6.87% |
| Blue | 64 | $1,209.60 | 3.54% |
| Red | 59 | $1,187.59 | 1.65% |
| White | 54 | $1,146.44 | (1.91%) |
| Dark Red | 70 | $1,136.45 | (2.81%) |
| Gold | 83 | $1,119.49 | (4.36%) |
| Total | 376 | $1,168.32 |
Compositional Spacing: this is a rough measure of how "busy" an iteration is (or taken another way, a measure of the density of the number of individual visual elements within each piece)
| Compositional Spacing | Number of Sales | Average Sales Price (USD) | Difference from Overall Average |
|---|---|---|---|
| Extra Wide | 83 | $1,228.55 | 5.16% |
| Wide | 72 | $1,205.73 | 3.21% |
| Medium | 101 | $1,186.84 | 1.58% |
| Tight | 120 | $1,088.98 | (7.27%) |
| Total | 376 | $1,168.32 |
Temporal Pattern: as a reminder, I'm thinking about this as "are there vertical black bars within the output that indicate a set pattern or regular tempo?"
| Temporal Pattern | Number of Sales | Average Sales Price (USD) | Difference from Overall Average |
|---|---|---|---|
| Yes | 146 | $1,178.97 | 0.91% |
| No | 230 | $1,161.57 | (0.58%) |
| Total | 376 | $1,168.32 |
Focal Point: I'm thinking of these as pieces that have a strong visual focal point as determined by large, bold blocks of centrally located color
| Focal Point | Number of Sales | Average Sales Price (USD) | Difference from Overall Average |
|---|---|---|---|
| Yes | 30 | $1,267.00 | 8.45% |
| No | 346 | $1,158.77 | (0.82%) |
| Total | 376 | $1,168.32 |
Takeaways: Okay, I know that was a lot of data...so if you skipped right to here I don't blame you. That said I think there are a few really interesting nuggets that we can take away from this analysis.
- First, the market (to date) has placed a fairly significant premium on a few of these features, specifically Black and Blue backgrounds (6.87% and 3.54% over the average), "Extra Wide" and "Wide" compositions (5.16% and 3.21% over the average), and those with a strong focal point (8.45% over the average)
- Second, there are several traits that trade at an average price that is well below average (indicating a market discount), specifically Gold and Dark Red backgrounds (4.36% and 2.81% below the average) and "Tight" compositions (7.27% below the average)
Value Vs. Rarity
The last area that I wanted to explore was what impact, if any, the rarity of individual traits had on average sale price. To test this out, I took the two features with the greatest number of possible variations (Background Color and Compositional Spacing) and plotted them to see how market value (as indicated by the average USD valuation of all sales in a specific category) compares against rarity (the percent of the total number of iterations that fall within a given category).
I went ahead and added reference lines for the averages for both metrics that breaks the resulting scatterplot down into four quadrants. It's a quick and dirty analysis, but we can think about it as follows: top-left is expensive and rare, top-right is expensive and common, bottom-left is inexpensive and rare, and bottom-right is inexpensive and common (all relatively speaking). I'll leave further analysis on this one to you dear reader.
Parting Thoughts
The market isn't everything. I wanted to do this analysis not because I think everything needs to tie back to dollars and cents, but because I personally find it fascinating to see how a market for a work of generative art evolves over time and how exhibited purchasing behavior (e.g. Gold backgrounds and Tight compositions trading at a relative discount) compare to the narratives that bubble up on Discord and Twitter.
If you're still reading this and you have thoughts for other research and analyses that you'd like to see, or if you just want to chat, feel free to reach out to me on Discord. Oh and don't forget to collect this article if you'd like to support my work!


