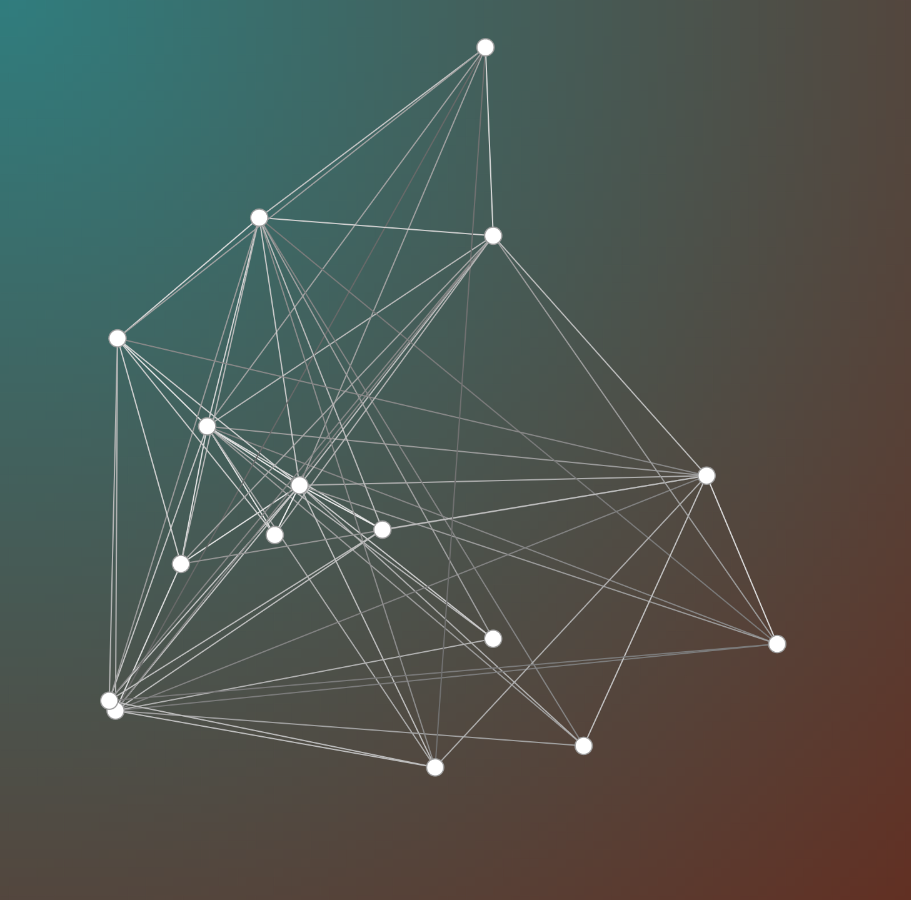
Brownian Graphs with Dynamic Points
written by reyrove
Welcome to the wild, sassy world of dynamic generative art! This code we’re diving into creates a stunning Brownian graph using p5.js and $fx.rand() for that extra magic sprinkle of randomness. Get ready for some fancy, dancey movement as points connect, bounce, and change color with each touch. Shall we begin?
Before we break it down, you can find the full code right here, ready for you to modify, play with, and create your very own visual wonder.
Let's Dive Into the Sass
const e = Math.min(innerWidth, innerHeight);
const canvas = {};
canvas.w = e;
canvas.h = e;
Oh yes, darling, we begin by dynamically setting the canvas size. No fixed dimensions here, no sir. We're taking the smallest dimension of the screen (innerWidth or innerHeight) and making sure the canvas fits like a glove!
let nextFrame = null;
const features = {};
The world we’re creating is full of features. That’s right—“features” that we’re going to define dynamically based on random values. But no rush—there’s plenty of magic to unveil!
var GraphMat = [];
var Points = [];
var diameter = [];
Here we go, three core variables to start:
- GraphMat : The matrix holding all those sexy point connections.
- Points : Our shining stars—each point moving on the canvas.
- diameter : The size of each point, because size does matter here.
The Color, Darling, It's All About the Color
const Backgroundcolors = [
  '#000000', '#34282C', '#3A3B3C', '#52595D', '#888B90', '#B6B6B6', '#C0C0C0',
  '#98AFC7', '#2F539B', '#2916F5', '#1F45FC', '#1589FF', '#14A3C7', '#6495ED',
  '#00BFFF', '#9AFEFF', '#16E2F5', '#81D8D0', '#01F9C6', '#3EA99F', '#045F5F',
  '#033E3E', '#2C3539', '#307D7E', '#006A4E', '#1AA260', '#22CE83', '#728C00',
  '#808000', '#08A04B', '#228B22', '#12AD2B', '#52D017', '#A0D6B4', '#16F529',
  '#00FF00', '#E2F516', '#E3F9A6', '#F3E5AB', '#FFEF00', '#FFD700', '#F6BE00',
  '#FFA600', '#CA762B', '#C68E17', '#966F33', '#513B1C', '#622F22', '#43302E',
  '#B83C08', '#EB5406', '#FF6700', '#FF8040', '#FF8674', '#FD1C03', '#E41B17',
  '#B21807', '#931314', '#550A35', '#7D0541', '#F8B88B', '#E75480v', '#F660AB',
  '#F52887', '#FA2A55', '#DC143C', '#FF00FF', '#DCD0FF', '#C8A2C8', '#FFF9E3',
  '#FFFAF0'
];
Take a deep breath, because honey, look at these colors. This vast array of background colors is ready to be mixed into a gradient that would make any artist jealous.
const BackgroundIndex1 = Math.floor($fx.rand() * Backgroundcolors.length);
const BackgroundIndex2 = Math.floor($fx.rand() * Backgroundcolors.length);
Two lucky background colors are chosen from our palette using $fx.rand(). Randomness, baby! Every single time, we’ll be surprising you with a whole new look.
Feature Time!
features.backgroundColour1 = Backgroundcolors[BackgroundIndex1];
features.backgroundColour2 = Backgroundcolors[BackgroundIndex2];

features.numberOfstartPoint = Math.floor($fx.rand() * 12 + 3);
features.minimumNumlink = Math.floor($fx.rand() * (features.numberOfstartPoint - 1));
features.boundaryBuffer = e / ($fx.rand() * 20 + 10);
Here’s where we decide the core features of our Brownian dance:
- backgroundColour1 and backgroundColour2 : Those colors we randomly picked? Yep, they’re our backdrop, forming a magical gradient.
- numberOfstartPoint : Randomly selecting the number of starting points on our canvas.
- minimumNumlink : Each point must connect to at least a few others—because what is life without connection?
- boundaryBuffer : The buffer to ensure our points stay within the canvas boundaries, like a sassy little dancefloor!
Graphs & Points – Let the Show Begin!
GraphMat = generateSymmetricGraphMatrix(features.numberOfstartPoint, features.minimumNumlink);
Points = generateRandomPoints(features.numberOfstartPoint, e, e, features.boundaryBuffer);
We generate the Graph Matrix and the Points, giving them life with random locations, random sizes, and random velocities. This dancefloor is filling up fast!
Drawing the Scene – The Star Performance
function draw() {
  diagonalGradientRect(0, 0, e, e, features.backgroundColour1, features.backgroundColour2);
  drawGraph(GraphMat, Points, e, features.balldiameter);
  Points = movePoints(Points, features.balldiameter, features.balldiameter / 4, features.balldiameter / 4, e, e, features.boundaryBuffer);
  $fx.preview();
}
Oh, it’s time to draw! We lay down that gradient background, and then the graph structure is drawn—connecting points in a beautiful tangle of lines. And just like a night out on the town, our points move gracefully (or chaotically), bouncing, shifting, and occasionally bumping into one another. 💥
Interaction – Let’s Shake Things Up
function mousePressed() {
  const newPoint = { x: mouseX, y: mouseY, color: color(255), touched: false };
  // ... (adding the new point to the graph and connecting it)
}
Of course, you’re not just here to watch. Click anywhere, and a brand-new point will appear, connecting itself to others, becoming part of this ever-growing, dancing web. 🕸️
Wrapping it Up with a Bow 🎀
In short, this script creates a living, breathing, dynamic graph—with points dancing across the screen, connecting with each other, changing colors, and responding to your every click. Each run will generate a unique piece of digital art, like the touch of a lover's hand, but with $fx.rand() adding that extra spark of randomness.
Oh, and if you press ‘S’, you can save this beauty as a GIF! Because darling, we want to remember the magic we create, don’t we? 💖
With love, sass, and all the glitter in the world, by Frostbond Coders. 😘