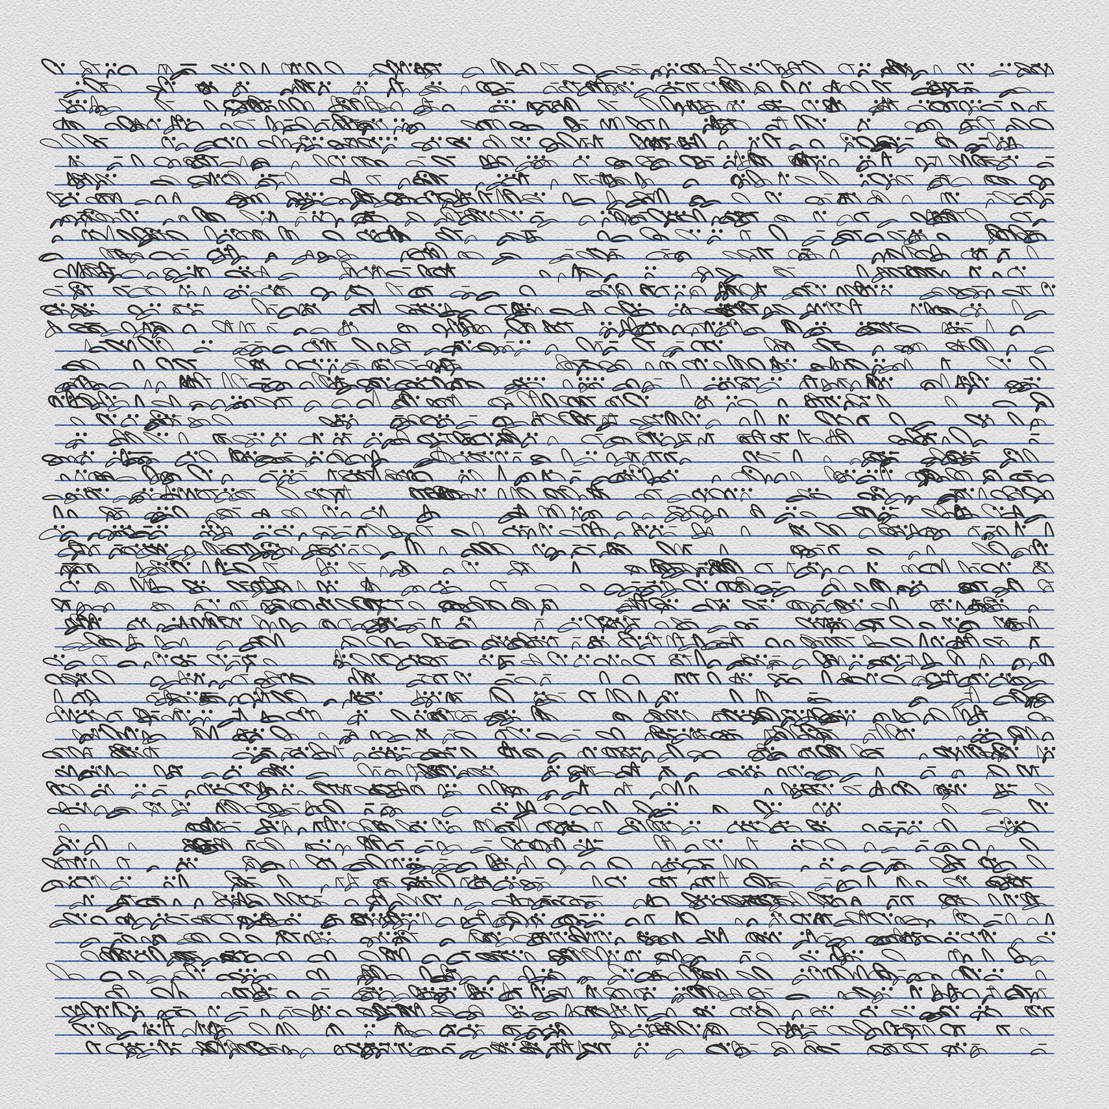
Asemic Writing (intermediate)
written by Jonathan Barbea...
Step 1: Setting up the Canvas and Color Mode
In the first step, we create a canvas of size 1500x1500 and set the color mode to HSB. This allows us to specify colors using hue, saturation, brightness, and opacity values. We also set the background color to a light gray hue of 0, saturation of 0, and brightness of 95.
function setup() {
  pixelDensity(2.0);
  createCanvas(1500, 1500); // create a 1280x720 canvas
  colorMode(HSB, 360, 100, 100, 100); // utilise l'espace de couleur HSB (teinte, saturation, luminosité)
  background(0, 0, 95); // Utilise HSB pour définir le fond en noir
Step 2: Initializing Variables
We then initialize some variables that we will use in our code in the setup() function. The spacingX and spacingY variables determine the size of the cells in our grid. The margin variable determines the margin on the border of the canvas, and the pass variable determines the number of passes our code will make.
  let spacingX = 20; // Cette variable détermine la taille des cellules de notre gril
  let spacingY = 25; // Cette variable détermine la taille des cellules de notre grille
  let margin = width / 15 - spacingY; // Cette variable détermine la marge de notre grille
  let pass = 3; // This variable determines the number of passesel
Step 3: The Main Loop
We first loop through the number of pass and then we use a nested loop to iterate over the x and y coordinates of the canvas. We use the random function to get a random number between 0 and 1, which we will use to determine the type of line we will draw.
for (i = 0; i < pass; i++) {
    for (let x = margin; x < width - margin; x += spacingX) {
      // loop through x
      for (let y = margin; y < height - margin; y += spacingY) {
        // loop through y
        let rand = random(1); // get a random number between 0 and 1
Step 4: Drawing the Baseline
we will draw a blue line for the baseline. This line is created using the line function, which takes two sets of x and y coordinates as arguments.
        strokeWeight(2);
        stroke(220, 80, 60, 50);
        line(x, y + spacingY, x + spacingX, y + spacingY);
Step 5: Drawing Bezier Curves
If the random number is greater than 0.75, we will draw a curve. The bezier curve is created using the bezier function, which takes four sets of x and y coordinates as arguments: two control points and two end points. We set the control points using random values between -spacingX * 2 and spacingX * 2, and -spacingY * 2 and spacingY * 2.
if (rand > 0.75) {
  // make a blue line for baseline
  strokeWeight(2);
  stroke(220, 80, 60, 50);
  line(x, y + spacingY, x + spacingX, y + spacingY);


  // set random bezier control points
  let xanchor1 = random(-spacingX * 2, spacingX * 2);
  let yanchor1 = random(-spacingY * 2, spacingY * 2);
  let xanchor2 = random(-spacingX / 2, spacingX / 3);
  let yanchor2 = random(-spacingY / 3, spacingY / 2);


  // make a bezier curve
  stroke(0, 0, 20, 100);
  strokeWeight(random(1, 3));
  noFill();
  bezier(x, y + spacingY, x + xanchor1, y + yanchor1, x + xanchor2, y + yanchor2, x + spacingX, y + spacingY);
Step 6: Adding Variations
To add variations to our writing, we use if statements to check the value of the random number. If the random number is between 0.75 and 0.8, we will draw a line.
// if random number is between 0.75 and 0.85
if (rand < 0.8) {
  // draw a line
  line(x, y + spacingY / 2, x + spacingX, y + spacingY / 2);
}
If the random number is between 0.8 and 0.85, we will draw two dots.
// if random number is between 0.8 and 0.85
if (rand > 0.8 && rand < 0.85) {
  // draw two dots
  strokeWeight(5);
  point(x, y + spacingY / 2);
  point(x + spacingX, y + spacingY / 2);
}
And that's it! You can use this code as a starting point to create your own AESEMIC writing in P5.js. You can experiment with different values for the variables, different colors, and different shapes to create unique and interesting AESEMIC writing styles. I hope you liked this article :)
PS: Next I will show how to make Textile while using this aesemic algorithm as a starting point :)